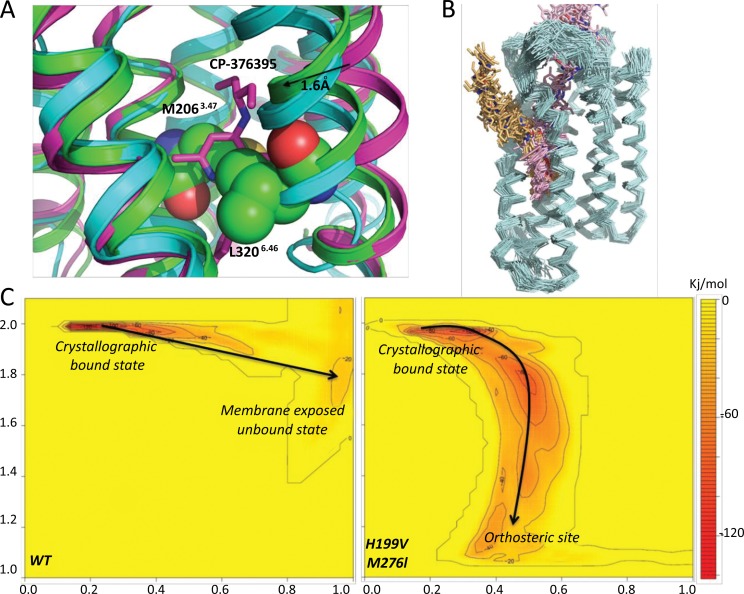
Fig. (2).
Analysis of CP-376395 binding to CRF1R. A) Comparison of CP-376395-CRF1RP22121 complex (in magenta), apo CRF1RP22121 (in green) and GCGR crystal structure (in cyan). Residues M2063.47 and L3206.46 are shown in space fill representation with carbon, nitrogen and oxygen atoms coloured green, blue and red respectively. CP-376395 is shown in stick representation with carbon, nitrogen and oxygen atoms coloured magenta, blue and red respectively B) The two predicted ligand binding paths are compared, in pink starting from the orthosteric site and in yellow from within the membrane. Binding paths are shown using snapshots of the ligand position during the simulation of binding and dissociation. The protein backbone is shown in cyan as ribbon. C) Free energy landscape predicted by the WTMetaD simulation for the dissociation event of CP-376395 in the wild type receptor (left) and in the double mutant H199V, M276I (right). Y axis represents the path CV defining the position on the path, while the X axis the distance from the path CV. The free energy surface is colour-coded from yellow to red (0 to -137 kJ/mol) and the positions of the bound and dissociated states are indicated. (The color version of the figure is available in the electronic copy of the article).

