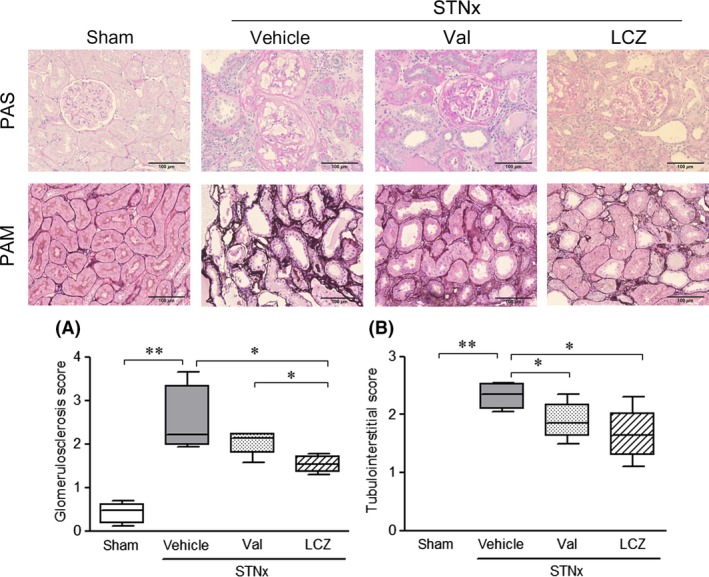
Figure 6.

Renal histological changes after the repeated dosing of valsartan‐(15 mg/kg) and LCZ696‐(30 mg/kg) for 8 weeks. Data were obtained in rats survived at 8 weeks. Representative images of periodic acid‐schiff staining (PAS, A) and periodic acid silver‐methenamine (PAM, B) were shown in the upper panel. Scale bar: 100 μm, Number of animals; n = 4 in the vehicle and valsartan‐(15 mg/kg) groups, and n = 5 in the LCZ696‐(30 mg/kg) and sham groups. STNx; subtotal nephrectomy, *P < 0.05, **P < 0.01; Bars indicate 90% tile and 10% tile, and boxes indicate 75% tile to 25% tile with lines of median values inside the boxes.
