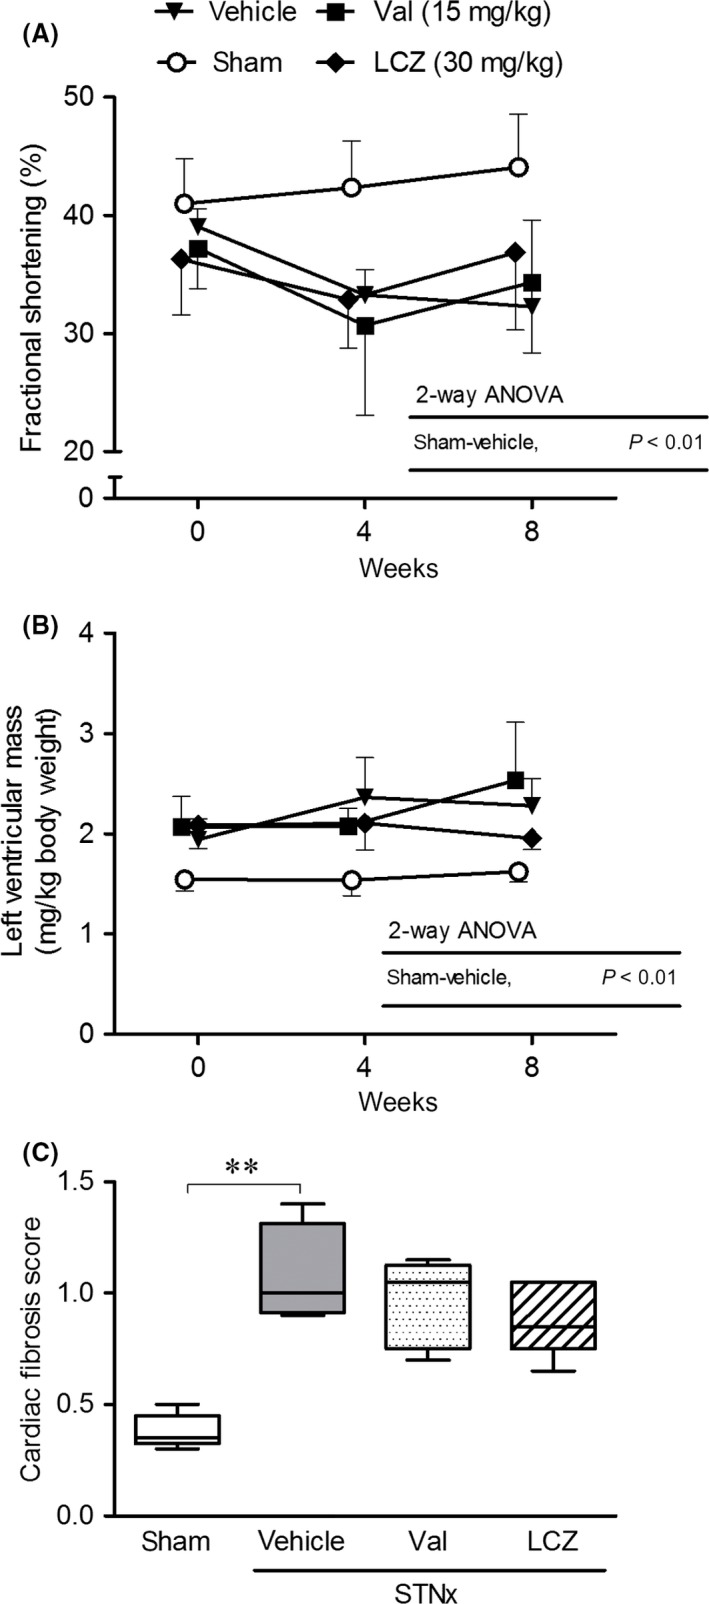
Figure 7.

Cardiac function during the repeated dosing of valsartan‐(15 mg/kg) and LCZ696‐(30 mg/kg) for 8 weeks, and cardiac fibrosis at the end of the treatment. All echocardiographic data obtained at each observation point were used. Number of animals in each group (week 0‐week 4‐week 8); n = 5‐5‐5 in the sham, n = 6‐4‐4 in the vehicle, n = 6‐5‐4 in the valsartan‐(15 mg/kg), and n = 6‐6‐5 in the LCZ696‐(30 mg/kg). STNx; subtotal nephrectomy, **P < 0.01; (A, B) Mean ± SD, (C) Bars indicate 90% tile and 10% tile, and boxes indicate 75% tile to 25% tile with lines of median values inside the boxes.
