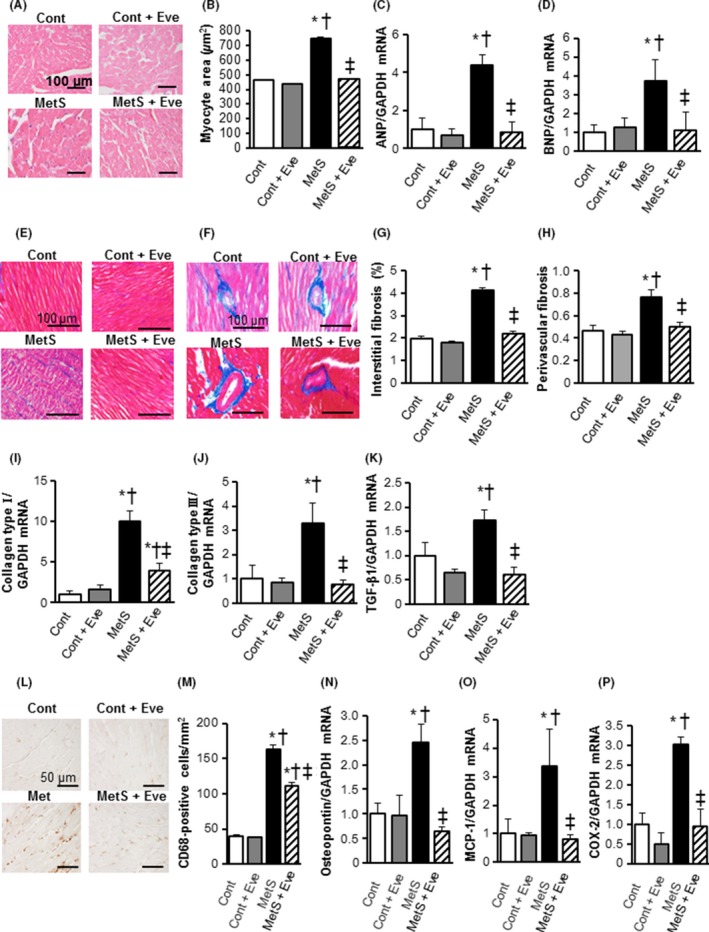
Figure 2.

Cardiomyocyte hypertrophy, fibrosis and inflammatory in the left ventricle of rats from the four experimental groups at 13 weeks of age. (A) Representative sections (hematoxylin‐eosin stain) of the left ventricular (LV) myocardium. Scale bars show100 μm. (B) Quantitative measurements of cross‐sectional area of cardiac myocytes. (C, D) Expression of markers of cardiac hypertrophic response. Atrial natriuretic peptide (ANP, C) and brain natriuretic peptide (BNP, D) mRNA levels measured by RT‐PCR in LV tissue samples. Data were normalized to the amount of Gapdh mRNA and then expressed relative to the mean value for DS/lean rats treated with vehicle. (E, F) Histological analysis of fibrosis by Azan‐Mallory staining in perivascular (upper panels) or interstitial (lower panels) regions in the left ventricular myocardium. Scale bars, 100 μm. (G, H) Percentage of interstitial and perivascular fibrosis in the left ventricular (LV) myocardium. (I–K) Relative mRNA expression of collagen I, III, and transforming growth factor (TGF)‐β1 by quantitative PCR. (L) Immunohistochemistry using anti‐CD68 in the LV myocardium. Scale bars. 100 μm. (M) Quantification of immunohistochemical CD68 levels. (N–P) mRNA expression levels of the inflammatory markers osteopontin, monocyte chemoattractant protein‐1 (MCP‐1), and cyclooxygenase (COX)‐2 in the left ventricle. Values in (B) through (D), (G) through (K), and (M) through (P) are expressed as means ± SEM for animals. [n = 8, 10, 7, and 12 for Cont, Cont + Eve, MetS, and MetS + Eve]. *P < 0.05 versus CONT, †P < 0.05 versus Cont + Eve, ‡P < 0.05 versus MetS.
