Figure 3.

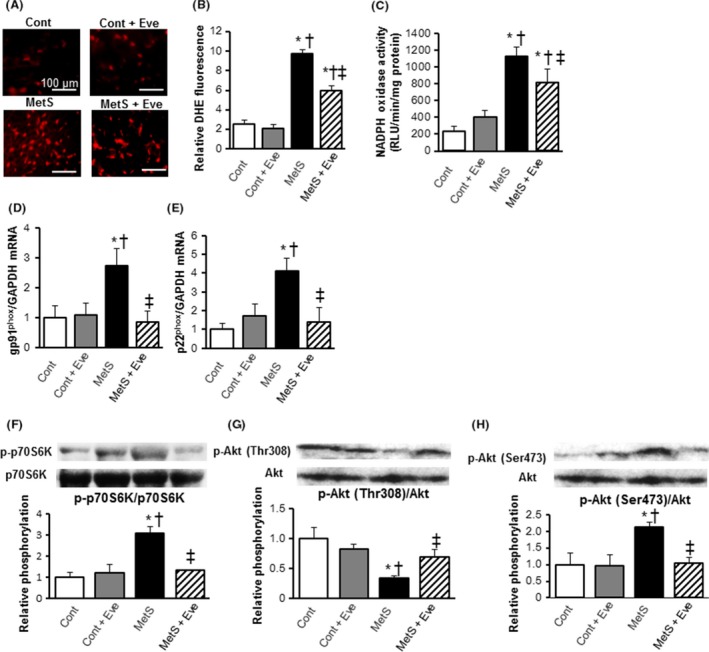
Oxidative stress, and insulin signaling in the left ventricle of rats from the four experimental groups at 13 weeks of age. (A) Impact of everolimus on cardiac oxidative stress level detected by fluorescence dye dihydroethidium (DHE; red spots) Scale bars, 100 μm. (B) DHE‐positive area was quantified as a percentage in each total high power field area. (C) Myocardial NADPH oxidase activity (D, E) Quantitative RT‐PCR analysis of p22phox and gp91phox mRNAs. (F–H) Evaluation of Akt/mTOR/p70S6K signal activity by western blotting analysis. Levels of phospho‐p70S6K (F), phospho‐Thr308‐Akt (G), and phospho‐Ser473‐Akt (H). All quantitative data represent means ± SEM. [n = 8, 10, 7, and 12 for Cont, Cont + Eve, MetS, and MetS + Eve (A–C) or n = 6 for each group (D–H)] *P < 0.05 versus CONT, †P < 0.05 versus Cont + Eve, ‡P < 0.05 versus MetS.
