Figure 4.

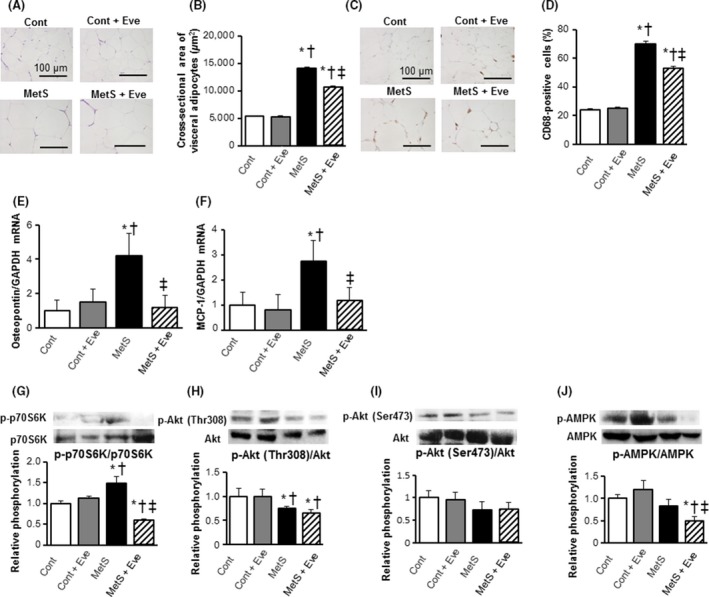
Visceral adipose tissue pathology. (A, B) Histology and mean cross‐sectional area of visceral adipocytes. (C) Representative photomicrographs showing immunohistochemical analysis using an anti‐CD68 antibody in visceral adipose tissue. Scale bars, 100 μm. (D) Quantification of anti‐CD68 positive macrophages as shown in (C). (E, F) mRNA expression levels of the inflammatory markers, osteopontin and monocyte chemoattractant protein‐1 (MCP‐1). (G–J) Evaluation of insulin signal Akt/mTOR/p70S6K and AMPK activity. Western blot analysis of the phosphorylation of p70S6K (G), Thr308‐Akt (H), Ser473‐Akt (I), and AMPK (J). All quantitative data represent means ± SEM. [n = 8, 10, 7, and 12 for Cont, Cont+Eve, MetS, and MetS+Eve (B and D–F) or n = 6 for each group (G–J)] *P < 0.05 versus CONT, †P < 0.05 versus Cont + Eve, ‡P < 0.05 versus MetS.
