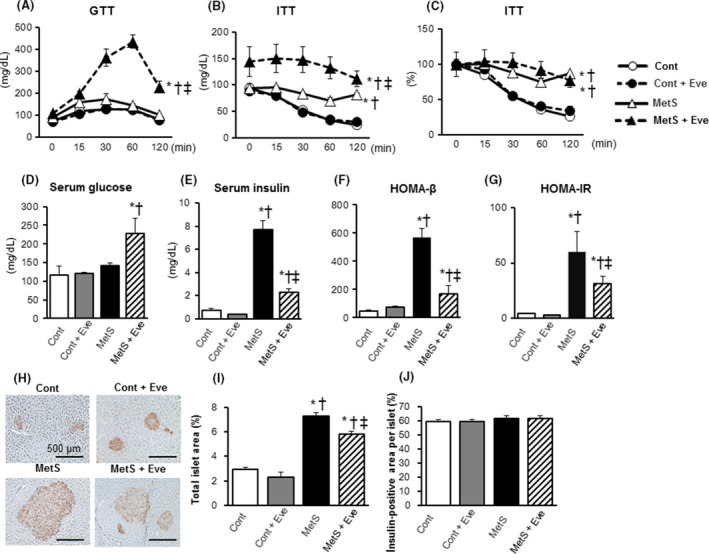
Figure 6.

Glucose metabolism. (A–G) Effects on the oral glucose tolerance test (OGTT), the insulin tolerance test (ITT), the fasting serum glucose, the fasting serum insulin, HOMA‐β, and HOMA‐IR. (H) Immunohistochemistry of pancreatic sections stained for insulin and (I, J) its‐associated morphological parameters. Scale bars, 500 μm. All quantitative data represent means ± SEM. [n = 5, 6, 6, and 7 (A–G) or n = 8, 10, 7, and 12 (I, J) for Cont, Cont + Eve, MetS, and MetS + Eve] *P < 0.05 versus Cont, †P < 0.05 versus Cont + Eve, ‡P < 0.05 versus MetS.
