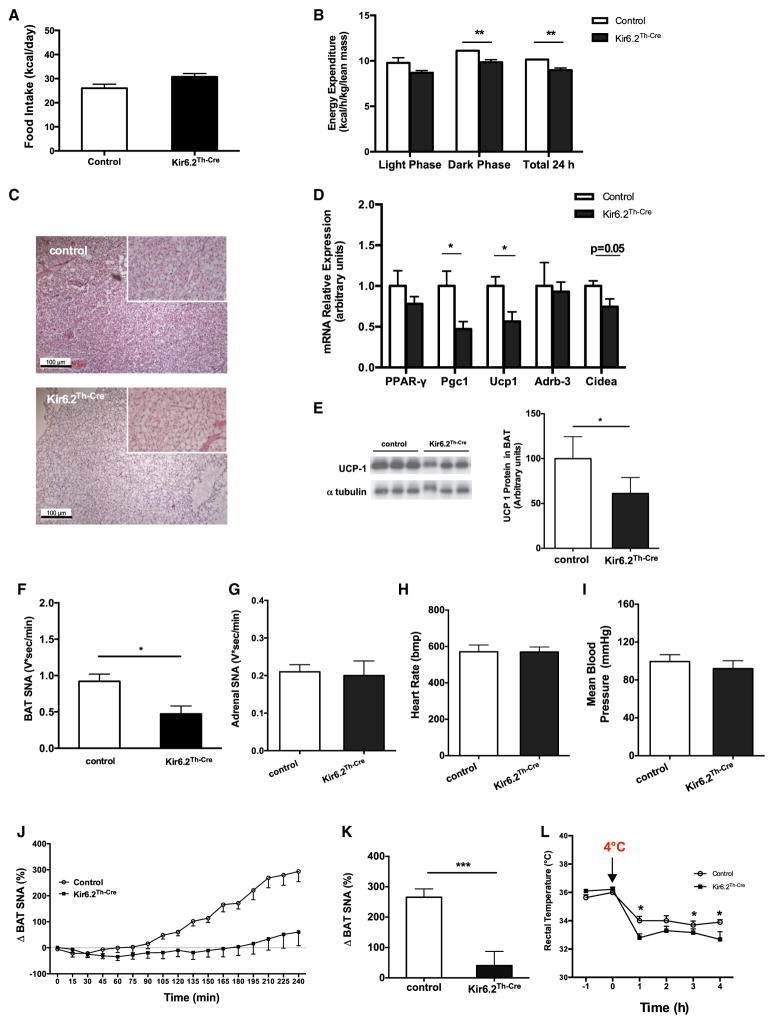
Figure 2. Impaired BAT SNA in Kir6.2TH-Cre Mice.
(A) Average daily food intake of 15-week-old male control (n = 12) and Kir6.2TH-Cre mice (n = 14) on HFD.
(B) Energy expenditure corrected for lean body mass of 20-week-old male control (n = 12) and Kir6.2TH-Cre mice (n = 13) on HFD.
(C) Representative hematoxylin and eosin (H&E) staining of BAT of a 20-week-old male control (upper panel) and Kir6.2TH-Cre mice (lower panel) on HFD (10× magnification in the small square).
(D) Relative expression of peroxisome proliferator-activated receptor γ (Pparg [PPAR-γ]), peroxisome proliferator-activated receptor coactivator 1α (Ppargc1a [Pgc1]), uncoupling protein 1 (Ucp1), β3-adrenergic receptor (Adrb3), and cell-death-inducing DFF45-like effector protein a (Cidea) in BAT extracts from 20-week-old control (n = 6) and Kir6.2TH-Cre mice (n = 6) on HFD.
(E) Immunoblot analysis (left) and quantification (right) of UCP1 protein expression in BAT of 20-week-old control and Kir6.2TH-Cre mice on HFD. α-tubulin was used as a loading control.
(F) Quantification of BAT SNA of 15-week-old control (n = 5) and Kir6.2TH-Cre mice (n = 5) on HFD.
(G) Adrenal SNA in 15-week-old control (n = 6) and Kir6.2TH-Cre mice (n = 6) on HFD.
(H and I) Heart rate and mean arterial pressure in control (n = 4) and Kir6.2TH-Cre mice (n = 5) measured in fully awake and unrestrained mice.
(J) BAT SNA response induced by i.c.v. glucose injection in control (n = 8) and Kir6.2TH-Cre mice (n = 5) on HFD.
(K) A comparison of BAT SNA responses induced by i.c.v. glucose injection (an average of the last hour of recording) between control and Kir6.2TH-Cre mice.
(L) Rectal temperature of 15-week-old control (n = 6) and Kir6.2TH-Cre mice (n = 6) on HFD upon cold exposure (+4°C) for 4 hr.
Data are expressed as mean ± SEM. *p < 0.05, **p < 0.01, and ***p < 0.001 between control and Kir6.2TH-Cre mice. See also Figure S3.

