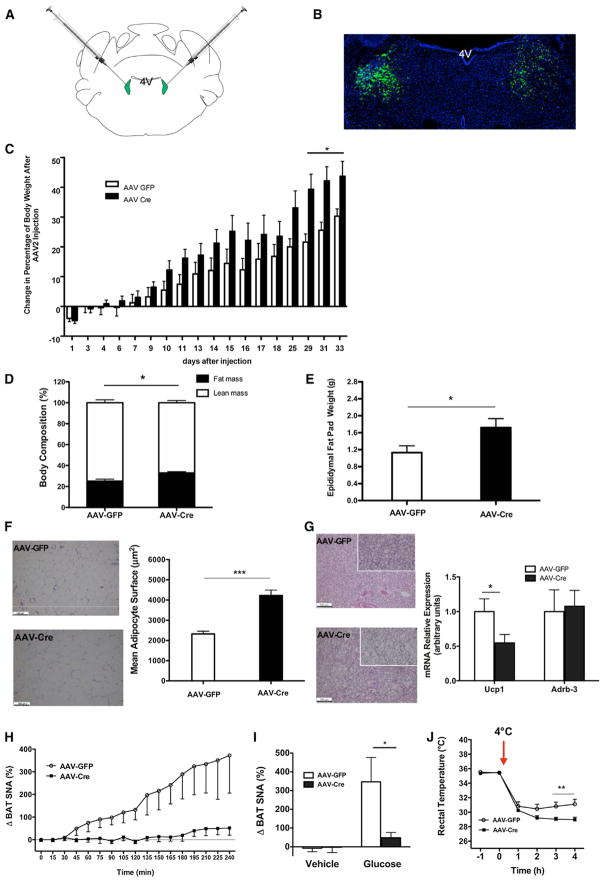
Figure 4. KATP Channels in the LC Control BAT Function and Energy Homeostasis.
(A) A schematic representation showing the localization of AAV injection. AAV expressing either GFP or Cre was injected into the LC of Rosa26Kir6.2 mice (anteroposterior, ~5.45; mediolateral, ± 1.28; dorsoventral, 3.65).
(B) Representative photomicrographs depicting GFP -immunoreactivity (green, GFP; blue, DAPI nuclear staining) from Rosa26Kir6.2 mice bilaterally injected with AAV-GFP vectors into the LC.
(C) Change of body weight after bilateral LC injection of AAV-GFP (n = 6) or AAV-Cre (n = 8). Rosa26Kir6.2 mice exposed to HFD from 3 weeks of age on were injected with the respective AAV vectors at the age of 8 weeks, and body weight was followed for another 4 weeks. Change of body weight after AAV vector injection is expressed as a percentage the difference from preinjection body weight.
(D) Body composition (% lean and fat mass) of mice expressing the mutant form of Kir6.2 specifically in LC (AAV-Cre) (n = 8) versus control (AAV-GFP) (n = 6) 7 weeks after AAV vector injection measured by NMR.
(E) Increased epididymal fat pad weight in mice expressing the mutant form of Kir6.2 specifically in LC (AAV-Cre) (n = 7) versus control (AAV-GFP) (n = 6) 7 weeks after AAV vector injection.
(F) Representative H&E staining of epididymal adipose tissue (left) of a 15-week-old male control mice (AAV-GFP; upper panel) and AAV-Cre mice (lower panel) on HFD. Quantification of mean adipocyte surface in epididymal adipose tissue of 20-week-old male control (AAV-GFP, n = 6) and AAV-Cre mice (n = 6) on HFD (right).
(G) Representative H&E staining of BAT (left) of a 15-week-old male control (AAV-GFP, upper panel) and AAV-Cre (lower panel) mice on HFD (10× magnification in the small square). The relative expression of uncoupling protein 1 (Ucp1) and β3-adrenergic receptor (Adrb3) in BAT extracts of control (AAV-GFP, n = 5) and AAV-Cre mice (n = 7) on HFD (right). The expression of indicated messenger RNAs was normalized to that of Hprt, and the resultant value for each group was normalized to the expression of the target gene in control mice.
(H) Time course of BAT SNA response induced by i.c.v. glucose (100 nM) in HFD-fed Rosa26Kir6.2 mice that received either AAV-GFP (n = 6) or AAV-Cre (n = 6) into the LC.
(I) A comparison of BAT SNA responses after i.c.v. injection of vehicle or glucose between HFD-fed Rosa26Kir6.2 mice that received either AAV-GFP (vehicle, n = 3; glucose, n = 6) or AAV-Cre (vehicle, n = 3; glucose, n = 6) into the LC.
(J) Rectal temperature of AAV-GFP (n = 5) and AAV-Cre microinjected mice (n = 8) on HFD upon cold exposure (+4°C).
Data are expressed as mean ± SEM. *p < 0.05 and **p < 0.01 between control (AAV-GFP) versus AAV-Cre mice. See also Figure S4.

