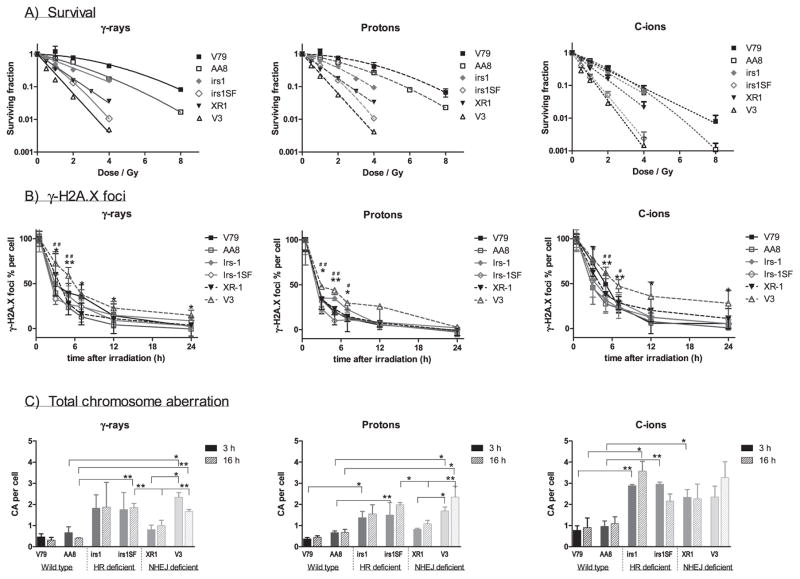
FIG. 4.
Comparison of cell lines. Panel A: Survival curves of cell lines were plotted by each radiation type; γ rays, protons and C ions. The wild-type V79 (■) and AA8 (□) cells were most resistant, followed by HR-deficient irs1 (
 ) and NHEJ-deficient XR1 (▼); HR-deficient irs1SF (
 ) and NHEJ-deficient V3 (△) were found to be the most sensitive to all radiation types examined. Panel B: Formation and dissolution of γ-H2AX foci after irradiation with γ rays, protons and C ions. Student’s t test: **P < 0.01, *P < 0.05 of V3 compared with wild-type cell; ##P < 0.01, #P < 0.05 of V3 compared with HR-deficient irs1SF cell. Panel C: Chromosome aberrations induced by 1 Gy γ ray, protons and C ions after 3 (filled column) and 16 h (gradient column) irradiations were plotted in each cell line examined after subtracting the number of 0 Gy irradiated cells. Student’s t test: **P < 0.01, *P < 0.05. Error bars represent SD.

