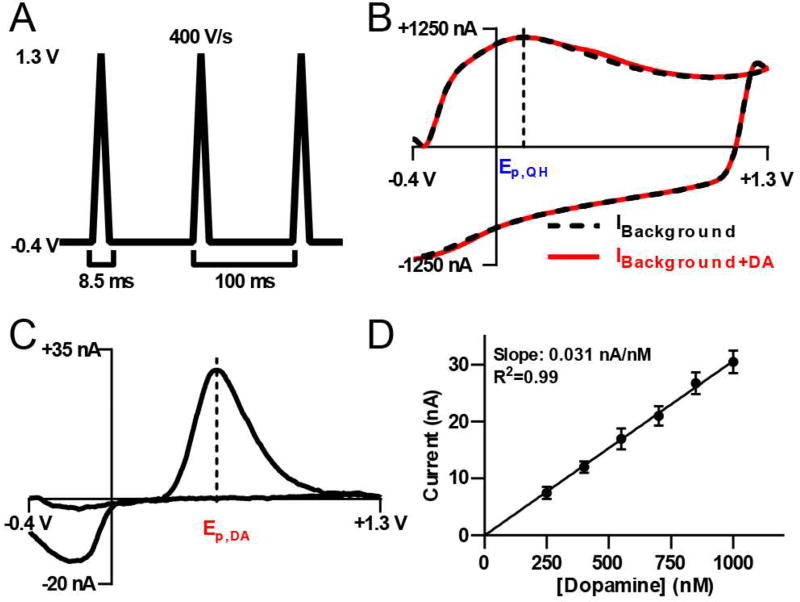
Figure 2.
Overview of fast-scan cyclic voltammetry. A) A triangular waveform from −0.4 V to +1.3 V is applied at 400 V/s and repeated at 10 Hz. B) Representative background (black) and dopamine (red) CVs. C) A representative background-subtracted CV for 1 µM dopamine. In both B) and C), potential and current are plotted as the abscissa and ordinate, with dashed lines indicating positions of Ep,QH and Ep,DA, respectively. D) A calibration curve for dopamine using a single CFME. Dopamine concentration and current at Ep,DA are plotted on the abscissa and ordinate, respectively. Data are presented as mean ± standard deviation (n=3 replicate injections).

