Figure 3.
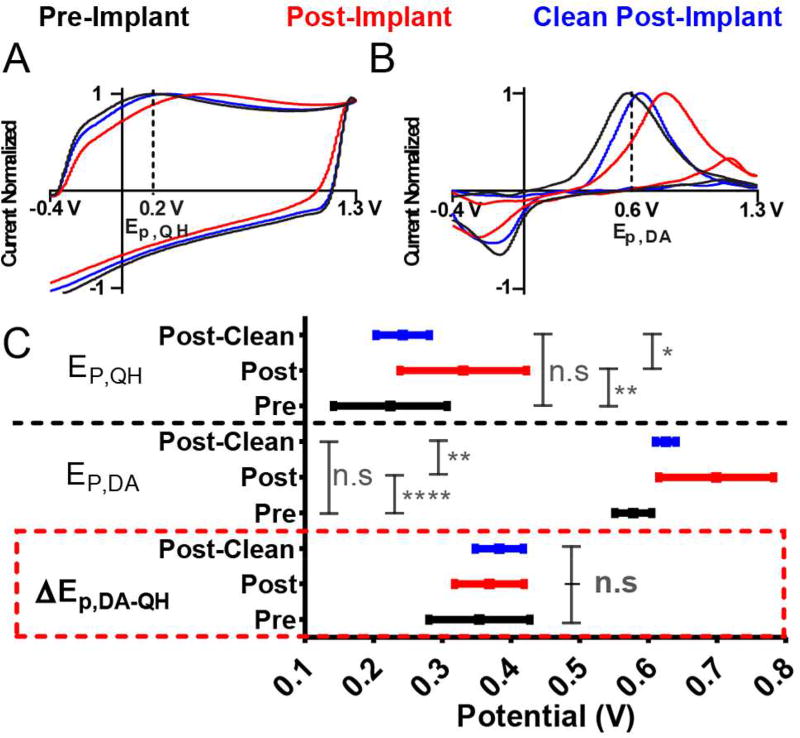
The electrode surface influences oxidation potential. Normalized A) background CVs and B) background-subtracted dopamine CVs collected on an electrode: 1) before tissue implantation (black), 2) post-implantation (red) and 3) post-implantation and cleaning in IPA (blue). Potential and normalized current are plotted as the abscissa and ordinate, respectively. Dashed lines indicate nominal values of the oxidation potentials. C) Summary of Ep,QH (top), Ep,DA (middle), and ΔEp,DA-QH (bottom) as a function of the electrode state. Data represent mean ± standard deviation (n=12 electrodes). Significance was determined via a one-way ANOVA with Tukey’s post-test.

