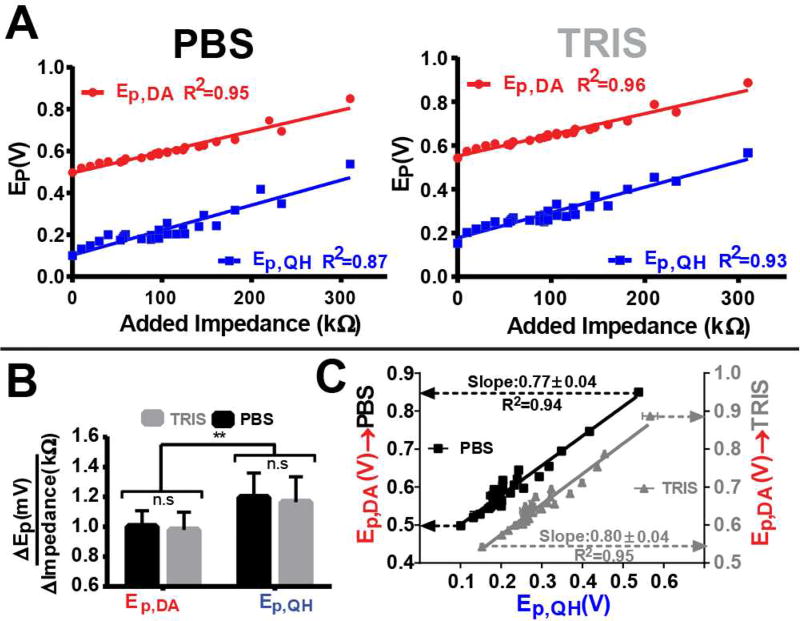
Figure 7.
Establishing a relationship between Ep.QH and Ep,DA. A) Ep.QH (blue) and Ep,DA (red) as a function of added impedance (abscissa) in both PBS (left) and TRIS (right). B) Comparison of the slopes (mV/kΩ) of the regression model for both Ep,QH and Ep,DA as a function of added impedance in PBS (black) and TRIS (gray). Significance was determined via a two-way ANOVA. C) Plot of Ep,QH (abscissa) versus Ep,DA (ordinate) resulting from all impedance preparations in PBS (black, left ordinate) and TRIS (gray, right ordinate). ANCOVA was used to compare the two regression models. In all cases error bars represent the mean ± standard deviation (n=5).

