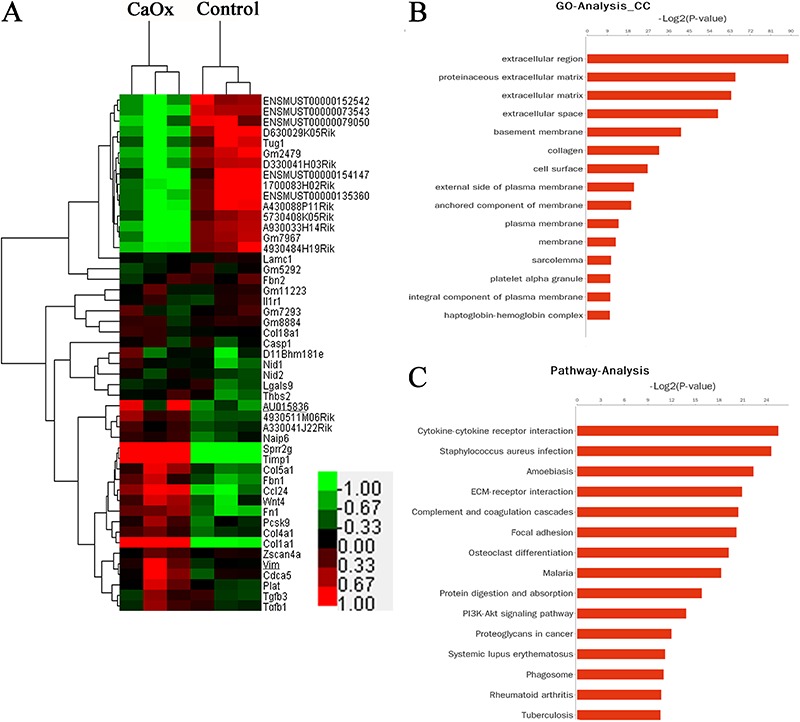
Figure 2. Differential expression of lncRNAs between the mouse kidneys exposed to glyoxylate and those from the control group. Hierarchical clustering analysis of 2165 mRNAs and 376 lncRNAs (A) that were differentially expressed between the mouse kidneys with calcium oxalate (CaOx) crystals and those from the control group (fold-change >1.5; P<0.05). Gene Ontology (GO) categories were based on the cellular components of differentially expressed genes (B). P<0.01 and FDR <0.05 were used as the thresholds for selecting the significant GO categories. KEGG pathway analysis of the differentially expressed genes (C). P<0.01 and FDR<0.05 were used as the thresholds for selecting the significant KEGG pathways; LogP is the logarithm of the P value.