Abstract
Objective:
Fractionated stereotactic radiotherapy (FSRT) is a relatively new option for the treatment of brain metastases. We performed a quantitative systematic review to determine if local control (LC) following is affected by FSRT dosing regimen.
Methods:
We reviewed articles describing LC following FSRT for brain metastases. LC data from each study were extracted from actuarial survival curves and aggregated to form a single data set. LC curves were generated using the Kaplan–Meier method. Log-rank testing and Cox proportional hazards modelling were utilized to test for associations between the biologically effective dose (BED) and LC. Tumour control probability modelling was performed to illustrate the relationship between the BED and the likelihood of LC after FSRT.
Results:
10 studies (720 metastases) met inclusion criteria. Prescription doses ranged from 18 to 42 Gy, delivered in 3–12 fractions (BED range: 29–100 Gy10). 1- and 2-year actuarial LC rates were 80% and 69%, respectively. Increasing BED was associated with improved LC (HR = 0.77 per increase of 10 Gy10, p = 0.009). Tumour control probability models demonstrated that the BEDs of 40, 50 and 60 Gy10 yield predicted 1-year LC rates of 73%, 78% and 84%, respectively. The BEDs of 40, 50 and 60 Gy10 yield 2-year LC rates of 62%, 69% and 81%, respectively.
Conclusion:
FSRT provides high rates of LC for patients with brain metastases. We found evidence for a dose–response relationship that should be explored in prospective trials.
Advances in knowledge:
This review identified a dose–response relationship for LC in patients treated with FSRT for brain metastases.
INTRODUCTION
Radiotherapy is a key component of the treatment of brain metastases, which represent the most common intracranial neoplasm in adults.1,2 Single-fraction stereotactic radiosurgery (SRS) is an appealing option for patients with a limited number of brain metastases,3–5 but both the efficacy and the safety of SRS may be compromised when treating lesions that are large and/or close to sensitive normal structures. Fractionated SRT (FSRT) is now commonly used in such cases to try to improve the therapeutic ratio of local radiotherapy. However, prospective trials to guide the implementation of this technique have not been performed.
Objectives
To systematically and quantitatively review published experiences using FSRT for brain metastases to determine local control (LC) rates with this treatment approach. We also explore associations between LC rates and FSRT dosing regimen.
METHODS AND MATERIALS
Study selection
A search was conducted of PubMed (1990–January 2016) using the Preferred Reporting Items for Systematic Reviews and Meta-Analyses guidelines. Two search terms were used: (1) fractionated stereotactic radiation therapy AND brain metastases and (2) hypofractionated radiosurgery AND brain metastases. Records were initially screened for full text availability. There were no studies excluded for lack of full-text availability.
Eligibility criteria
Both retrospective and prospective studies were included in our analysis. Case reports were not included. Filters were utilized to exclude animal studies and studies written in languages other than English. Abstracts and full texts of the remaining studies were reviewed. If an abstract was found to be relevant, the full text of the study was retrieved by the first author (SB) and screened. Studies were included in this analysis based on consensus between the first author (SB) and the senior author (NO). We excluded series in which a wide range of dosing and fractionation schedules were used, as one purpose of this study was to explore associations between FSRT dosing and LC.
Data extraction/collection process
From each study that met all inclusion criteria, we tabulated the first author's name, year of publication, sample size, primary disease sites, FSRT dosing schedule and median follow-up. Individual lesion data were also extracted from Kaplan–Meier LC curves as previously described by Guyot et al.6 For series where FSRT doses were prescribed to the isocentre, we calculated a planning target volume (PTV) dose based on the isodose line that was reported to cover the PTV. For each FSRT dosing schedule, a BED for the PTV was calculated using the linear quadratic (LQ) model with α/β = 10 Gy.
For patients who received simultaneous treatment for several lesions, each lesion was treated as an individual data point. LC was based on serial imaging in all the studies incorporated in this analysis. Response evaluations varied between the studies but generally were defined as the absence of radiological progressive disease at last follow-up. LC was evaluated using actuarial statistical methods; data were censored when patients were lost to follow-up or died without local progression.
Statistical analysis
The primary end point examined in this review was LC. The individual lesion LC data extracted from each article were aggregated to form a single data set. Kaplan–Meier LC curves were generated for the entire data set as well as after sorting lesions into two groups of approximately equal size based on the BED. Comparison of the two BED groups was performed using log-rank testing. Cox proportional hazards modelling was also performed to examine the association between the BED and LC.
Tumour control probability (TCP) modelling was performed as follows. LC data were sorted into three groups based on BED, and the actuarial LC rate at 1 year for each group was calculated. These three data points were fit to a standard TCP model:
where d is the BED, TCD50 is the BED required to achieve 50% tumour control and k is a fitting constant that is equal to 25 divided by the slope of the TCP curve at a BED equal to the TCD50.7 Data points were fit to the TCP model using least-squares optimization. We utilized a bootstrap resampling method to characterize the distributions of optimal model parameters and formulate 95% confidence bounds for the TCP curve.8 5000 iterations were performed. This process was repeated to develop a TCP model for actuarial LC rate at 2 years. These analyses were performed using MATLAB® (The MathWorks®, Natick, MA).
RESULTS
Study identification and selection
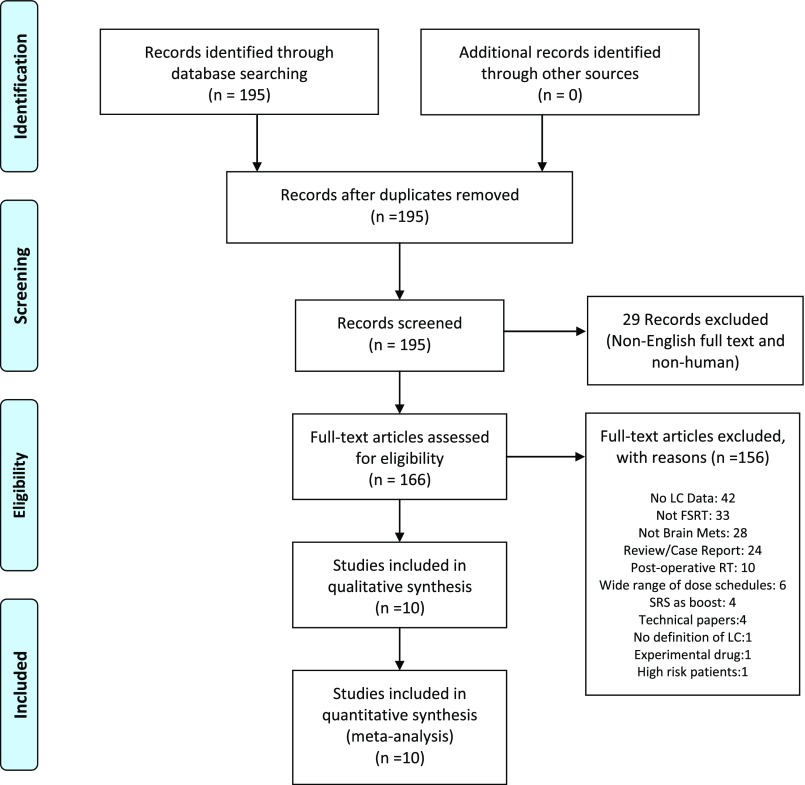
Our initial search results included 195 unique hits. Filters restricting the search to human studies written in the English language reduced this value to 166 hits. Of the 166 articles reviewed, 10 studies met all inclusion criteria and formed the data set of our analysis.9–18 Reasons for study exclusion are shown in Figure 1.
Figure 1.
Study selection. FSRT, fractionated stereotactic radiotherapy; LC, local control; Mets, metastases; RT, radiotherapy; SRS, stereotactic radiosurgery.
Study characteristics
The composite sample size was 720 metastases. The most common primary site of disease for patients with brain metastases was lung cancer, which accounted for 36% of all lesions, followed by breast cancer (12%) and melanoma (8%). Prescription doses ranged from 18 to 42 Gy, delivered in 3–12 fractions. BEDs ranged from 29 to 100 Gy10. Surveillance imaging procedures varied slightly between studies but typically included a MRI every 2–3 months (Table 1).
Table 1.
Characteristics of the 10 studies included in the present analysis
| First author (country) | Sample size | Tumour size (cm) | Histology (%) | Primary sites | FSRT schedule | Planning technique | Prescription point/volume | Median follow-up, in months |
|---|---|---|---|---|---|---|---|---|
| Rejakesari et al16 (United States) | 60 patients, 70 lesions | Median diameter: 1.7 (0.4–6.4) | NSCLC: 37% Breast: 20% Melanoma: 20% SCLC: 7% GI: 6% Renal cell: 6% Other: 4% |
26 lung, 14 breast, 14 melanoma, 16 other | 5 Gy × 5 fractionsa | LINAC: conformal arcs or static IMRT | PTV (90–95% IDL) | 14 |
| Minniti et al15 (Italy) | 135 patients, 171 lesions | N/A | NSCLC: 48% Breast carcinoma: 24% Melanoma: 14% Colon carcinoma: 4% Renal cell: 5% Other: 5% |
65 lung, 32 breast, 19 melanoma, 19 other | 56%: 9 Gy × 3 fractions 44%: 12 Gy × 3 fractions | LINAC: dynamic arcs | PTV (80–90% IDL) | 11 |
| Feuvert et al12 (Italy) | 12 patients, 12 lesions | Median diameter: 4.4 (3.2–5.95) | Adenocarcinoma: 75% Squamous: 17% Large cell: 8% |
6 lung, 3 breast, 3 other | 7.7 Gy × 3 fractions | LINAC: dynamic arcs | PTV (70% IDL) | 7 |
| Kim et al13 (Korea) | 40 patients, 49 lesions | N/A | N/A | Not described | 6 Gy × 6 fractions | LINAC: dynamic arcs | PTV (91% IDL) | 7 |
| Aoyoma et al10 (Japan) | 87 patients, 140 lesions | N/A | Adenocarcinoma: 55% Squamous: 14% Small cell: 8% Thyroid carcinoma: 6% Renal cell: 6% Others: 11% |
52 lung, 7 colon, 6 breast, 22 other | 8.75 Gy × 4 fractionsa | LINAC | Isocentre: PTV (80–90% IDL) | 6 |
| Aoki et al9 (Japan) | 44 patients, 65 lesions | N/A | Adenocarcinoma: 45% Squamous: 25% Small cell: 8% Others: 11% |
34 lung, 5 breast, 2 oesophagus, 3 other | 18–30 Gy in 3–5 fractions | LINAC: fixed coplanar beams | Isocentre PTV (90% IDL) | 6 |
| Kwon et al14 (Korea) | 27 patients, 52 lesions | Median diameter: 1.6 (0.17–3.12) | NSCLC: 56% Adenocarcinoma: 12% Small cell: 12% Melanoma: 9.6% Others: 9.6% |
20 lung, 2 breast, 2 melanoma, 3 other | 20–36 Gy in 4–6 fractions | LINAC: non-coplanar arcs | Isocentre PTV (85% IDL) | 7 |
| Ernst Stecken et al11 (Germany) | 51 patients, 72 lesions | Median diameter: 2.27 (0.85–5.22) | Breast: 27% Melanoma: 25% Rectal: 21% Renal cell: 6% NSCLC: 15% Others: 10% |
19 breast, 18 melanoma, 15 rectal, 19 other | 30–35 Gy in 5 fractions | LINAC dynamic arcs: 78% Conformal: 22% |
PTV (90% IDL) | 7 |
| Saitoh et al17 (Japan) | 49 patients, 78 lesions | Median diameter: 1.2 (0.4–3.8) | Adenocarcinoma: 73% Others: 27% |
49 lung | 39–42 Gy in 3 fractions | LINAC: non-coplanar beams | PTV (90% IDL) | 17.4 |
| Narayana et al18 (United States) | 20 patients, 20 lesions | Lung: 35% Melanoma: 20% Renal cell: 15% Breast: 10% GI: 10% Ovarian: 5% Sarcoma: 5% |
7 lung, 4 melanoma, 3 renal, 2 breast, 2 other | 6 Gy × 5 fractions | LINAC | PTV (100% IDL) | 10 |
FSRT, fractionated stereotactic radiotherapy; GI, gastrointestinal; IDL, isodose line; IMRT, intensity-modulated radiotherapy; LINAC, linear accelerator; N/A, not available; NSCLC, non-small cell lung cancer; PTV, planning target volume; SCLC, small cell lung cancer.
A small subset of lesions was treated with other dosing schedule(s).
Analysis of outcomes
Local control
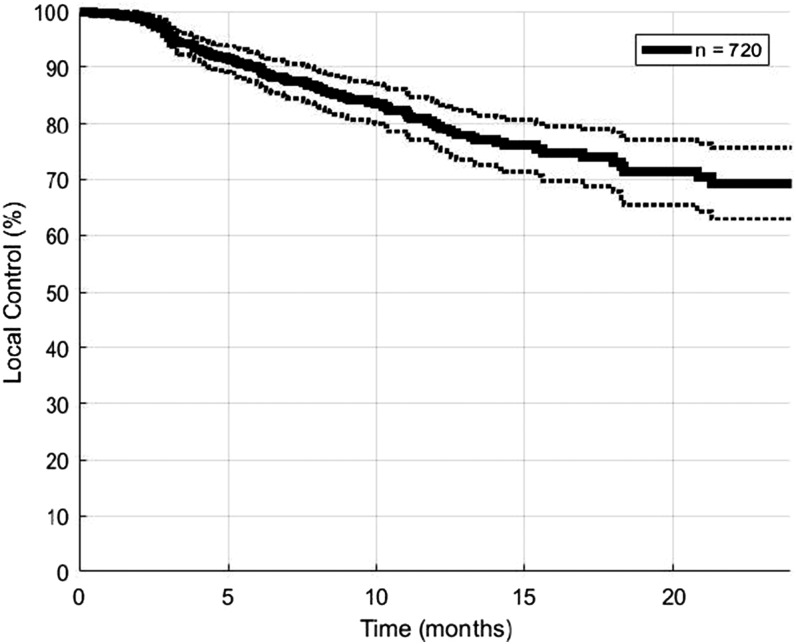
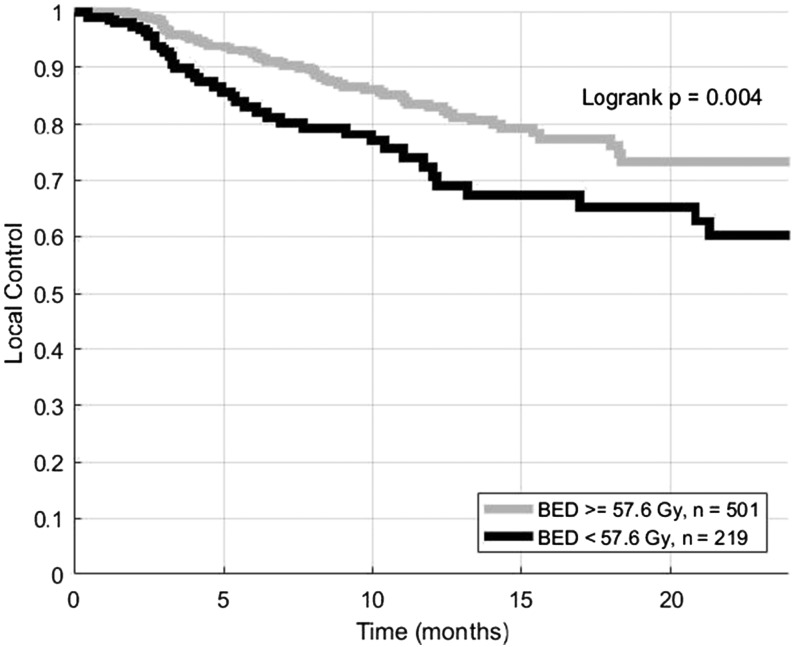
The median follow-up duration was 7 months. 1- and 2-year actuarial LC rates for the entire cohort were 80% and 69%, respectively (Figure 2). 1- and 2-year actuarial LC rates were 84% and 73% for lesions treated with BEDs of at least 57.6 Gy10, which was the median BED in our data set. Lesions treated with the BEDs of <57.6 Gy10 had 1- and 2-year actuarial LC rates of 72% and 60% (Figure 3, log-rank p = 0.004). Cox proportional hazards modelling demonstrated that high BED was associated with increased LC (HR = 0.77 per increase of 10 Gy10, p = 0.009).
Figure 2.
Local control for 720 brain metastases treated with fractionated stereotactic radiotherapy. Dotted lines represent 95% confidence intervals.
Figure 3.
Local control for brain metastases treated with fractionated stereotactic radiotherapy. Lesions are split into those that received at least 57.6 Gy10, which was the median biologically effective dose (BED) in the data set, vs other lesions.
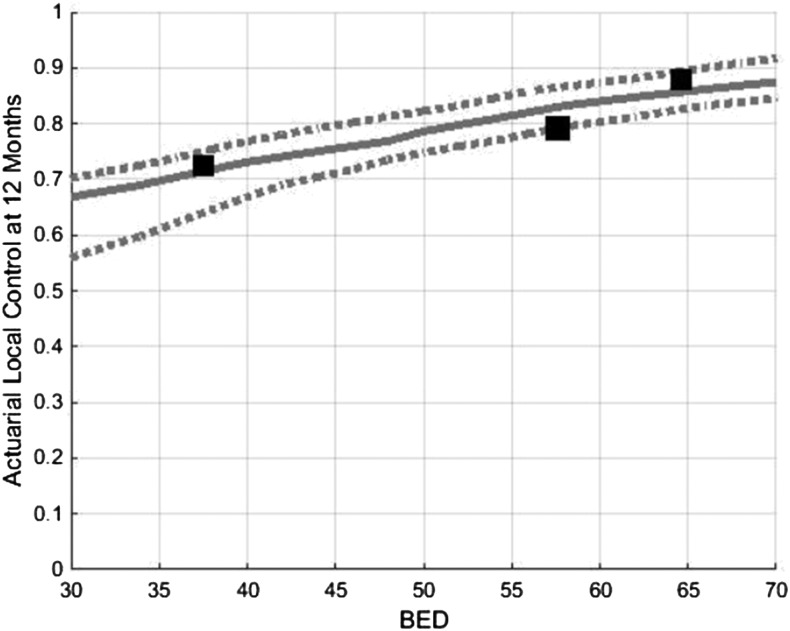
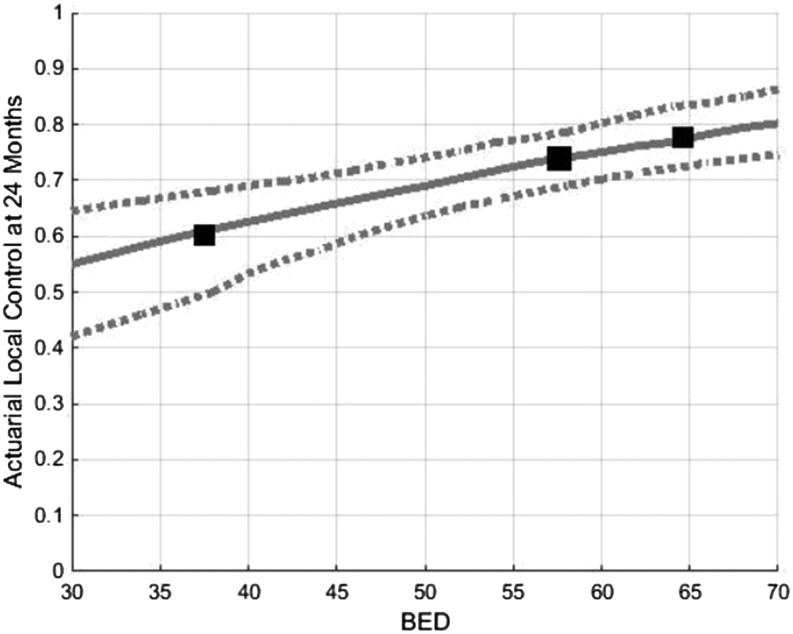
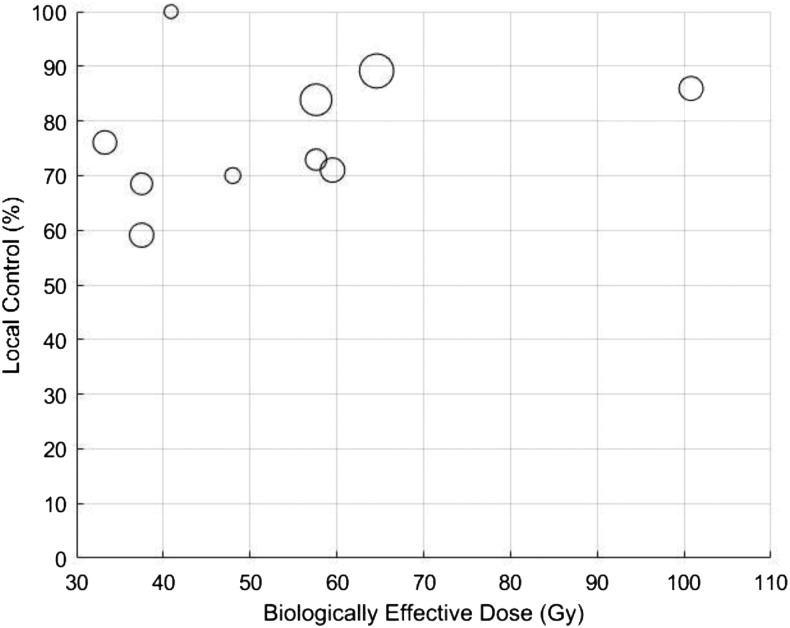
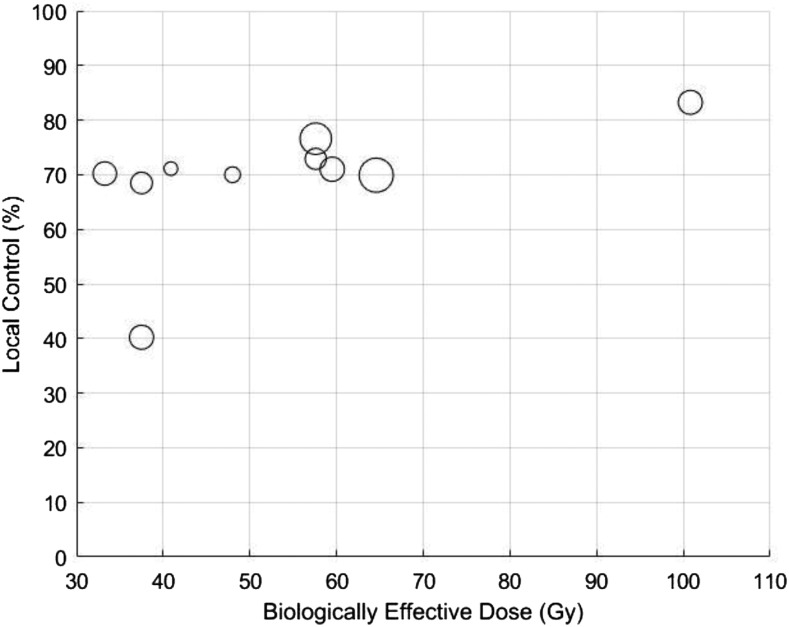
In the optimal TCP model for LC at 1 year, k was 30 and TCD50 was 12 Gy. BED10 values of 40, 50 and 60 Gy10 yield predicted LC rates at 1 year of 73%, 78% and 84%, respectively (Figure 4). R2 for the 1-year TCP prediction model was 0.825. In the model for LC at 2 years, k was 35 and TCD50 was 30 Gy. BED10 values of 40, 50 and 60 Gy10 yield predicted LC rates at 2 years of 62%, 69% and 81%, respectively (Figure 5). R2 for the 2-year TCP prediction model was >0.999. Scatter plots of the represented studies to illustrate the relationship of LC to BED were generated (Appendix A).
Figure 4.
Tumour control probability modelling demonstrating predicted local control at 12 months as function of BED. Dotted lines represent 95% confidence intervals. BED, biologically effective dose.
Figure 5.
Tumour control probability modelling demonstrating predicted local control at 24 months as a function of BED. Dotted lines represent 95% confidence intervals. BED, biologically effective dose.
DISCUSSION
We performed a systematic review and pooled analysis of individual lesion data from published studies to evaluate LC rates following FSRT for patients with brain metastases. We have demonstrated that FSRT for metastatic brain tumours can yield high rates of LC and that the use of relatively aggressive dosing schedules has been associated with improved LC. These findings may have implications for the implementation of FSRT in the clinic as well as in the design of prospective FSRT trials.
National Comprehensive Cancer Network guidelines do not comment on the use of FSRT in either the definitive or post-operative setting for brain metastases.19 However, FSRT has clearly infiltrated routine clinical practice in many radiation oncology departments. As there is a lack of prospective trial data to guide the implementation of FSRT, we believe that this analysis provides valuable and novel information for clinicians. However, well-designed prospective studies are needed to optimize the delivery of FSRT and establish FSRT as an evidence-based treatment option for appropriate patients.
There is a paucity of data comparing single-fraction SRS and FSRT for the treatment of brain metastases. One large series retrospectively evaluated the efficacy of single-fraction SRS and several FSRT schedules and demonstrated that the two treatment techniques yielded comparable outcomes.20 That study could not be included in the present analysis because actuarial LC curves were not provided. One systematic review that included seven SRS series and four SRT series combined results with both techniques to create a TCP curve for 12-month LC that is comparable to what we generated in this FSRT review.21 Of note, FSRT is often considered for lesions that cannot be treated with SRS, therefore retrospective comparisons of SRS and FSRT may be confounded by important factors such as tumour size.
Several other systematic reviews have examined associations between FSRT dosing regimen and clinical outcomes. One study that included 260 patients suggested that higher BED10 may be associated with improved LC.22 Another study examined prognostic factors for patients with non-small-cell lung cancer who were treated with FSRT for brain metastases.23 Our study builds upon previous efforts and incorporates TCP modelling to help characterize the relationship between FSRT dosing regimen and LC rates.
Limitations of review
We utilized the LQ model to calculate the BEDs for each dosing regimen and allow comparison across studies. Although we acknowledge that there is controversy regarding the use of the LQ model in the setting of hypofractionation,24 we continue to favour the LQ model over other models for its simplicity and continued utility in clinical studies.25 Given the moderate fraction sizes utilized in FSRT, we deem it unlikely that our findings would be meaningfully changed by using of another survival model.
Overall survival and quality of life may be more meaningful end points for patients with brain metastases than LC. We still believe that examination of LC is important, as local disease often leads to salvage treatment with whole brain radiotherapy, which is known to cause fatigue, alopecia and neurocognitive deficits.26,27 Other salvage treatments such as repeat focal irradiation and systemic therapy carry other risks.
Quantifying 12- and 24-month LC rates following FSRT may seem inappropriate, since a minority of patients are evaluable for LC at these time points. However, improvements in systemic treatments, including the evolution of targeted therapy and immunotherapy for a variety of malignancies, are prolonging survival times for patients with metastatic cancer. Long-term efficacy of FSRT will therefore be a relevant concern for a growing proportion of patients with brain metastases. Continued study of radiotherapy outcomes is needed, as novel systemic agents may contribute to the control of brain metastases.28–30
One important aspect of FSRT that could not be evaluated in the present report is treatment-related toxicity. The most commonly reported complication following FSRT is radiation necrosis. However, the definitions of radiation necrosis utilized in the series we examined were often variable or unclear. We therefore deemed it imprudent to quantitatively evaluate toxicity rates or perform normal tissue complication probability modelling in the present analysis. Future studies on this topic should employ clear and consistent guidelines for scoring radiation necrosis which can easily be confused with treatment effects and/or disease progression.31,32
Although we could extract LC data for individual lesions from each study, we did not have other important details for each individual lesion, including histology and tumour size. Both factors may influence predicted LC following FSRT.14 We only included series that utilized relatively uniform FSRT dosing schedules in this analysis to minimize the risk that other variables would confound the observed association between BED and LC. However, a pooled analysis of individual patient data from multiple institutions will be an important next step in advancing our understanding of FSRT.
CONCLUSION
FSRT may provide high rates of LC for patients with brain metastases. We demonstrated a dose–response relationship that should be considered when choosing a dose and fractionation schedule.
Appendix A
Figure A1. Scatter plot of 1-year local control vs biologically effective dose for the 10 studies included in this analysis. Larger circles indicate greater sample size.
Figure A2. Scatter plot of 2-year local control vs biologically effective dose for the 10 studies included in this analysis. Larger circles indicate greater sample size.
Contributor Information
Sujith Baliga, Email: sbaliga@montefiore.org.
Madhur K Garg, Email: mgarg@montefiore.org.
Jana Fox, Email: jfox@montefiore.org.
Shalom Kalnicki, Email: skalnicki@montefiore.org.
Patrick A Lasala, Email: plasala@montefiore.org.
Mary R Welch, Email: mwelch@montefiore.org.
Wolfgang A Tomé, Email: wtome@montefiore.org.
Nitin Ohri, Email: ohri.nitin@gmail.com.
REFERENCES
- 1.Lohr F, Pirzkall A, Hof H, Fleckenstein K, Debus J. Adjuvant treatment of brain metastases. Semin Surg Oncol 2001; 20: 50–6. doi: https://doi.org/10.1002/ssu.1016 [DOI] [PubMed] [Google Scholar]
- 2.Soffietti R, Ruda R, Trevisan E. Brain metastases: current management and new developments. Curr Opin Oncol 2008; 20: 676–84. doi: https://doi.org/10.1097/CCO.0b013e32831186fe [DOI] [PubMed] [Google Scholar]
- 3.Bhatnagar AK, Flickinger JC, Kondziolka D, Lunsford LD. Stereotactic radiosurgery for four or more intracranial metastases. Int J Radiat Oncol Biol Phys 2006; 64: 898–903. doi: https://doi.org/10.1016/j.ijrobp.2005.08.035 [DOI] [PubMed] [Google Scholar]
- 4.Sahgal A, Aoyama H, Kocher M, Neupane B, Collette S, Tago M, et al. Phase 3 trials of stereotactic radiosurgery with or without whole-brain radiation therapy for 1 to 4 brain metastases: individual patient data meta-analysis. Int J Radiat Oncol Biol Phys 2015; 91: 710–17. doi: https://doi.org/10.1016/j.ijrobp.2014.10.024 [DOI] [PubMed] [Google Scholar]
- 5.Shaw E, Scott C, Souhami L, Dinapoli R, Kline R, Loeffler J, et al. Single dose radiosurgical treatment of recurrent previously irradiated primary brain tumors and brain metastases: final report of RTOG protocol 90-05. Int J Radiat Oncol Biol Phys 2000; 47: 291–8. doi: https://doi.org/10.1016/S0360-3016(99)00507-6 [DOI] [PubMed] [Google Scholar]
- 6.Guyot P, Ades AE, Ouwens MJ, Welton NJ. Enhanced secondary analysis of survival data: reconstructing the data from published Kaplan-Meier survival curves. BMC Med Res Methodol 2012; 12: 9. doi: https://doi.org/10.1186/1471-2288-12-9 [DOI] [PMC free article] [PubMed] [Google Scholar]
- 7.Okunieff P, Morgan D, Niemierko A, Suit HD. Radiation dose-response of human tumors. Int J Radiat Oncol Biol Phys 1995; 32: 1227–37. doi: https://doi.org/10.1016/0360-3016(94)00475-z [DOI] [PubMed] [Google Scholar]
- 8.Deasy JO, Chao KS, Markman J. Uncertainties in model-based outcome predictions for treatment planning. Int J Radiat Oncol Biol Phys 2001; 51: 1389–99. doi: https://doi.org/10.1016/s0360-3016(01)02659-1 [DOI] [PubMed] [Google Scholar]
- 9.Aoki M, Abe Y, Hatayama Y, Kondo H, Basaki K. Clinical outcome of hypofractionated conventional conformation radiotherapy for patients with single and no more than three metastatic brain tumors, with noninvasive fixation of the skull without whole brain irradiation. Int J Radiat Oncol Biol Phys 2006; 64: 414–18. doi: https://doi.org/10.1016/j.ijrobp.2005.03.017 [DOI] [PubMed] [Google Scholar]
- 10.Aoyama H, Shirato H, Onimaru R, Kagei K, Ikeda J, Ishii N, et al. Hypofractionated stereotactic radiotherapy alone without whole-brain irradiation for patients with solitary and oligo brain metastasis using noninvasive fixation of the skull. Int J Radiat Oncol Biol Phys 2003; 56: 793–800. doi: https://doi.org/10.1016/s0360-3016(03)00014-2 [DOI] [PubMed] [Google Scholar]
- 11.Ernst-Stecken A, Ganslandt O, Lambrecht U, Sauer R, Grabenbauer G. Phase II trial of hypofractionated stereotactic radiotherapy for brain metastases: results and toxicity. Radiother Oncol 2006; 81: 18–24. doi: https://doi.org/10.1016/j.radonc.2006.08.024 [DOI] [PubMed] [Google Scholar]
- 12.Feuvret L, Vinchon S, Martin V, Lamproglou I, Halley A, Calugaru V, et al. Stereotactic radiotherapy for large solitary brain metastases. Cancer Radiother 2014; 18: 97–106. doi: https://doi.org/10.1016/j.canrad.2013.12.003 [DOI] [PubMed] [Google Scholar]
- 13.Kim YJ, Cho KH, Kim JY, Lim YK, Min HS, Lee SH, et al. Single-dose versus fractionated stereotactic radiotherapy for brain metastases. Int J Radiat Oncol Biol Phys 2011; 81: 483–9. doi: https://doi.org/10.1016/j.ijrobp.2010.05.033 [DOI] [PubMed] [Google Scholar]
- 14.Kwon AK, Dibiase SJ, Wang B, Hughes SL, Milcarek B, Zhu Y. Hypofractionated stereotactic radiotherapy for the treatment of brain metastases. Cancer 2009; 115: 890–8. doi: https://doi.org/10.1002/cncr.24082 [DOI] [PubMed] [Google Scholar]
- 15.Minniti G, D'Angelillo RM, Scaringi C, Trodella LE, Clarke E, Matteucci P, et al. Fractionated stereotactic radiosurgery for patients with brain metastases. J Neurooncol 2014; 117: 295–301. doi: https://doi.org/10.1007/s11060-014-1388-3 [DOI] [PubMed] [Google Scholar]
- 16.Rajakesari S, Arvold ND, Jimenez RB, Christianson LW, Horvath MC, Claus EB, et al. Local control after fractionated stereotactic radiation therapy for brain metastases. J Neurooncol 2014; 120: 339–46. doi: https://doi.org/10.1007/s11060-014-1556-5 [DOI] [PubMed] [Google Scholar]
- 17.Saitoh J, Saito Y, Kazumoto T, Kudo S, Ichikawa A, Hayase N, et al. Therapeutic effect of linac-based stereotactic radiotherapy with a micro-multileaf collimator for the treatment of patients with brain metastases from lung cancer. Jpn J Clin Oncol 2010; 40: 119–24. doi: https://doi.org/10.1093/jjco/hyp128 [DOI] [PubMed] [Google Scholar]
- 18.Narayana A, Chang J, Yenice K, Chan K, Lymberis S, Brennan C, et al. Hypofractionated stereotactic radiotherapy using intensity-modulated radiotherapy in patients with one or two brain metastases. Stereotact Funct Neurosurg 2007; 85: 82–7. doi: https://doi.org/10.1159/000097923 [DOI] [PubMed] [Google Scholar]
- 19.Nabors LB, Ammirati M, Bierman PJ, Brem H, Butowski N, Chamberlain MC, et al. Central nervous system cancers. J Natl Compr Canc Netw 2013; 11: 1114–51. [DOI] [PMC free article] [PubMed] [Google Scholar]
- 20.Fokas E, Henzel M, Surber G, Kleinert G, Hamm K, Engenhart-Cabillic R. Stereotactic radiosurgery and fractionated stereotactic radiotherapy: comparison of efficacy and toxicity in 260 patients with brain metastases. J Neurooncol 2012; 109: 91–8. doi: https://doi.org/10.1007/s11060-012-0868-6 [DOI] [PubMed] [Google Scholar]
- 21.Wiggenraad R, Verbeek-de Kanter A, Kal HB, Taphoorn M, Vissers T, Struikmans H. Dose-effect relation in stereotactic radiotherapy for brain metastases. A systematic review. Radiother Oncol 2011; 98: 292–7. doi: https://doi.org/10.1016/j.radonc.2011.01.011 [DOI] [PubMed] [Google Scholar]
- 22.Rodrigues G, Warner A, Bauman G, Senan S, Lagerwaard F. Systematic review of fractionated brain metastases radiotherapy. J Radiat Oncol 2014; 3: 29–41. doi: https://doi.org/10.1007/s13566-012-0035-x [Google Scholar]
- 23.Kaul D, Angelidis A, Budach V, Ghadjar P, Kufeld M, Badakhshi H. Prognostic indices in stereotactic radiotherapy of brain metastases of non-small cell lung cancer. Radiat Oncol 2015; 10: 244. doi: https://doi.org/10.1186/s13014-015-0550-1 [DOI] [PMC free article] [PubMed] [Google Scholar]
- 24.Kirkpatrick JP, Meyer JJ, Marks LB. The linear-quadratic model is inappropriate to model high dose per fraction effects in radiosurgery. Semin Radiat Oncol 2008; 18: 240–3. doi: https://doi.org/10.1016/j.semradonc.2008.04.005 [DOI] [PubMed] [Google Scholar]
- 25.Brenner DJ. The linear-quadratic model is an appropriate methodology for determining isoeffective doses at large doses per fraction. Semin Radiat Oncol 2008; 18: 234–9. doi: https://doi.org/10.1016/j.semradonc.2008.04.004 [DOI] [PMC free article] [PubMed] [Google Scholar]
- 26.Kocher M, Soffietti R, Abacioglu U, Villa S, Fauchon F, Baumert BG, et al. Adjuvant whole-brain radiotherapy versus observation after radiosurgery or surgical resection of one to three cerebral metastases: results of the EORTC 22952-26001 study. J Clin Oncol 2011; 29: 134–41. doi: https://doi.org/10.1200/JCO.2010.30.1655 [DOI] [PMC free article] [PubMed] [Google Scholar]
- 27.Chang EL, Wefel JS, Hess KR, Allen PK, Lang FF, Kornguth DG, et al. Neurocognition in patients with brain metastases treated with radiosurgery or radiosurgery plus whole-brain irradiation: a randomised controlled trial. Lancet Oncol 2009; 10: 1037–44. doi: https://doi.org/10.1016/S1470-2045(09)70263-3 [DOI] [PubMed] [Google Scholar]
- 28.Shimato S, Mitsudomi T, Kosaka T, Yatabe Y, Wakabayashi T, Mizuno M, et al. EGFR mutations in patients with brain metastases from lung cancer: association with the efficacy of gefitinib. Neuro Oncol 2006; 8: 137–44. doi: https://doi.org/10.1215/15228517-2005-002 [DOI] [PMC free article] [PubMed] [Google Scholar]
- 29.Welsh JW, Komaki R, Amini A, Munsell MF, Unger W, Allen PK, et al. Phase II trial of erlotinib plus concurrent whole-brain radiation therapy for patients with brain metastases from non-small-cell lung cancer. J Clin Oncol 2013; 31: 895–902. doi: https://doi.org/10.1200/JCO.2011.40.1174 [DOI] [PMC free article] [PubMed] [Google Scholar]
- 30.Margolin K, Ernstoff MS, Hamid O, Lawrence D, McDermott D, Puzanov I, et al. Ipilimumab in patients with melanoma and brain metastases: an open-label, phase 2 trial. Lancet Oncol 2012; 13: 459–65. doi: https://doi.org/10.1016/S1470-2045(12)70090-6 [DOI] [PubMed] [Google Scholar]
- 31.Patel TR, McHugh BJ, Bi WL, Minja FJ, Knisely JP, Chiang VL. A comprehensive review of MR imaging changes following radiosurgery to 500 brain metastases. AJNR Am J Neuroradiol 2011; 32: 1885–92. doi: https://doi.org/10.3174/ajnr.A2668 [DOI] [PMC free article] [PubMed] [Google Scholar]
- 32.Dequesada IM, Quisling RG, Yachnis A, Friedman WA. Can standard magnetic resonance imaging reliably distinguish recurrent tumor from radiation necrosis after radiosurgery for brain metastases? A radiographic-pathological study. Neurosurgery 2008; 63: 898–903; discussion 904. doi: https://doi.org/10.1227/01.NEU.0000333263.31870.31 [DOI] [PubMed] [Google Scholar]


