
Figure 6.
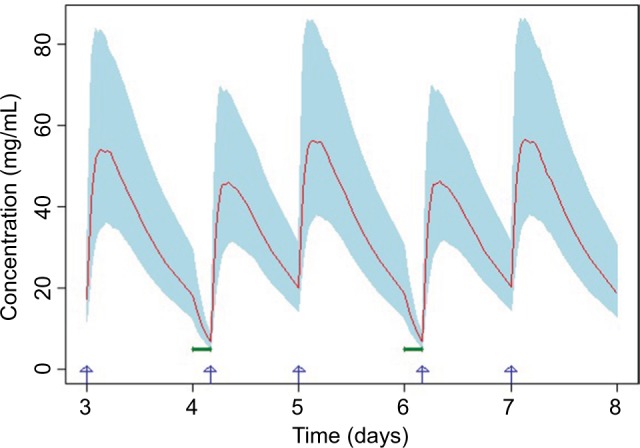
Simulated plasma concentration vs time profiles when the hemodialysis procedure is completed before pomalidomide administration.
Notes: Red line represents the mean of the simulated concentration vs time profile. Light blue shaded area represents the 90% CI of the simulated concentration vs time profile. Blue arrows represent pomalidomide dosing time. Bold green lines represent hemodialysis procedure (lasting for 4 h).