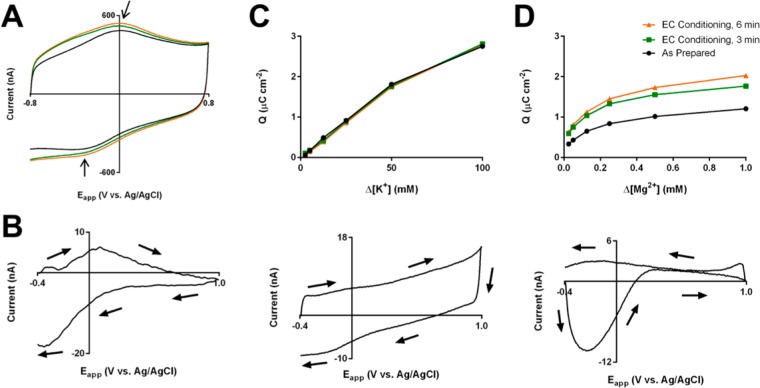
Figure 1.
FSCV signals in the absence of analytes and during ionic concentration changes in phosphate-buffered saline. (A) Total background currents for as-prepared carbon fiber microelectrodes (black) and after electrochemical conditioning for 3 and 6 min (green and orange, respectively). Arrows indicate the location of the peaks referenced in the text. (B) Background-subtracted CV (−0.4–1.0 V vs Ag/AgCl, 400 V/s, 10 Hz) for acidic pH shift (−0.15 pH units from pH 7.4) (C) Adsorption curves (2.5–100 mM, top) at each conditioning time point and representative background-subtracted CV (100 mM, bottom) for potassium injections. (D) Adsorption curves (0.025–1.0 mM, top) at each oxidation time point and representative background-subtracted CV (1.0 mM, bottom) for magnesium injections.

