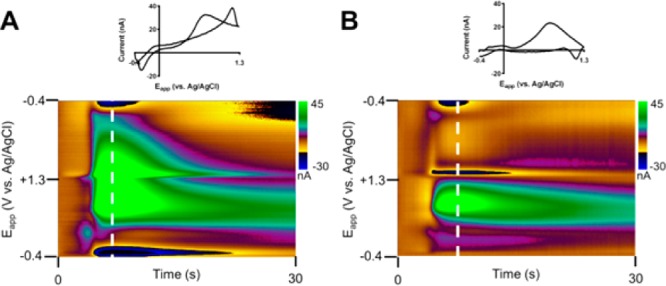
Figure 4.

In vivo analysis of supraphysiological release of neurotransmitters during a spreading depression event using the convolution-based method. (A) Uncorrected background-subtracted cyclic voltammogram (top) and color plot (bottom) at 7 s into the recording. (B) Same cyclic voltammogram (top) and color plot (bottom) after use of the convolution-based method for removal of capacitive artifacts. Note that the step portion of the waveform is not shown in the color plots. A single pinprick (−7.5 DV, 2–3 mm away from the recording site) was delivered prior to this recording.
