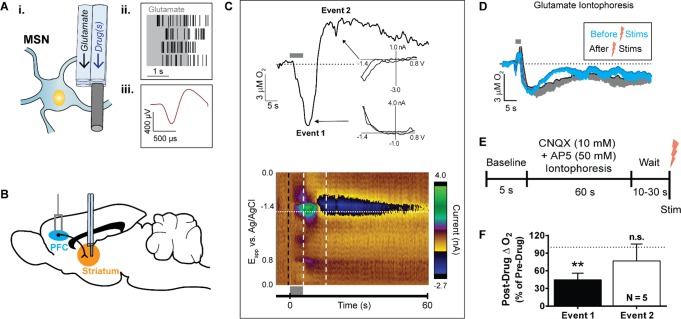
Figure 1.
Electrically stimulated glutamatergic cell bodies in the PFC elicit biphasic O2 changes in the striatum. (A) (i) The multimodal sensor ejected glutamate iontophoretically to determine proximity to glutamate-sensitive cells (e.g., medium spiny neuron, MSN). Sensor barrel diameters and carbon-fiber length not to scale. (ii) Four replicate perievent rasters, where each black tic represents a recorded single-unit action potential. In anesthetized subjects, glutamate ejections (gray box) evoked single-unit activity bursts that ceased soon after the ejection. (iii) Averaged single-unit waveform of the unit isolated in panel A, part ii. (B) Sagittal view of the chosen stimulated glutamatergic pathway. A bipolar stimulating electrode was placed into the PFC (blue) and a multimodal sensor was inserted into the dorsal striatum (orange). (C) (top) Current taken at the O2 reduction potential (−1.35 V, horizontal dotted line in color plot below) tracked the time course of O2 changes from the representative color plot below. First, O2 decreased during the stimulation (event 1) and subsequently increased above baseline following electrical stimulation (event 2). Cyclic voltammograms from each event (insets, each taken from horizontal white lines in color plot below) confirmed the identity of O2, with background subtraction taken at the color plot black dashed line. Slight hysteresis was attributed to concomitant endogenous ion fluctuations. (bottom) Color plot representation of cyclic voltammetry data recorded around a 100 pulse, 20 Hz, 300 μA electrical stimulation as indicated by the gray bar. Abscissa, applied voltage; ordinate, acquisition time of the cyclic voltammograms. Background-subtracted currents are color coded. (D) Averaged O2 changes evoked from 2 s glutamate iontophoresis ejections at the glutamate-sensitive striatal cells before the first electrical stimulation and 10 min after the last electrical stimulation (n = 6). Shading indicates −SEM. (E) Experimental paradigm for assessing local striatal iGluR influence over O2. PFC cell bodies were electrically stimulated after a cocktail of AP5 (50 mM) and CNQX (10 mM) was ejected at striatal terminals for 60 s. (F) Event 1 was significantly attenuated (**P = 0.001, Student’s t test) under iGluR blockade in the striatum. Error bars indicate +SEM.

