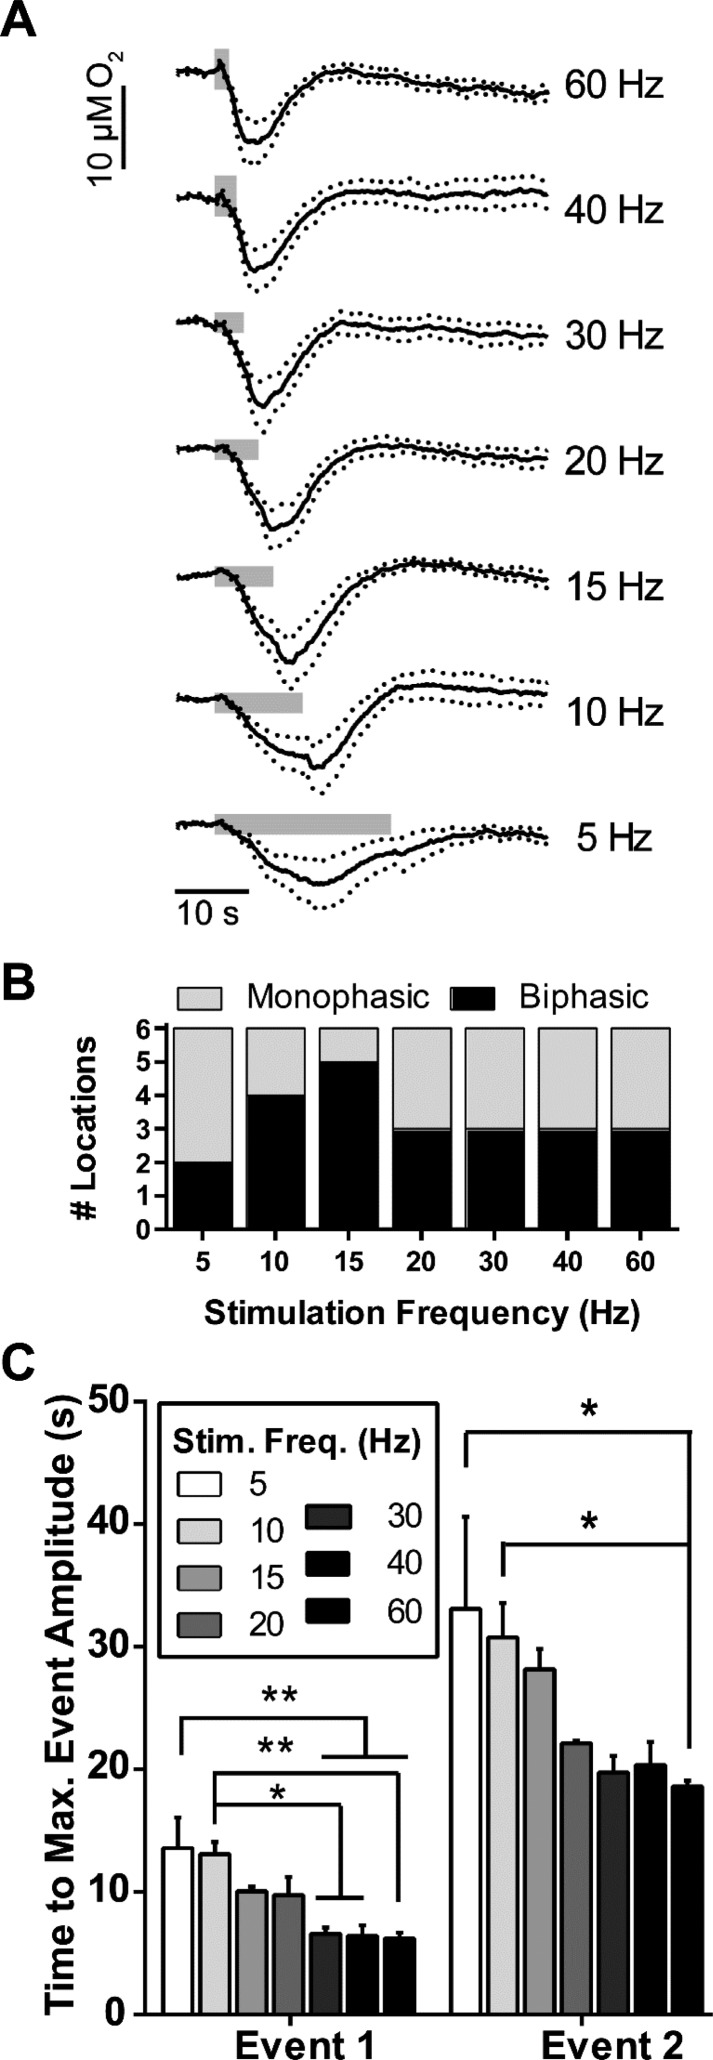
Figure 3.
PFC stimulation frequencies affected the time to reach maximal O2 decreases (i.e., event 1) and subsequent maximal O2 increases (i.e., event 2) in the dorsal striatum. (A) Current traces taken at the O2 reduction potential were averaged (n = 6), with their respective stimulation frequencies indicated to the right. The number of biphasic pulses applied and their amplitudes were kept constant (80 pulses and 300 μA, respectively). Gray bars indicate stimulation durations. Dotted lines indicate ±SEM. (B) Stimulus frequency did not affect whether or not the responses were biphasic. (C) The stimulus frequency affected the time to reach maximum event 1 O2 decreases and the subsequent event 2 O2 increases. Monophasic O2 responses were excluded from event 2 statistics. Error bars indicate ±SEM. Significance was determined with repeated measures one-way ANOVA and Bonferroni’s post hoc test. *P < 0.05, **P < 0.01.

