
Figure 2.
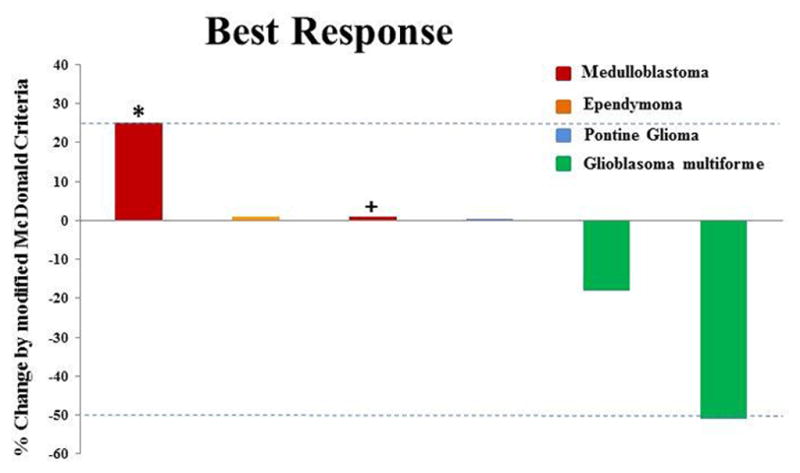
Individual patients/disease sites are represented by vertical bars on the X-axis. The best response per modified MacDonald criteria (%) is depicted on the Y-axis. Disease in four of the six patients was measurable. Of the two patients who were not measurable, one patient with stable disease (for 20 weeks) was assigned a value of +1% (+) and one patient was assigned a value of +25% for clinical progression (*).