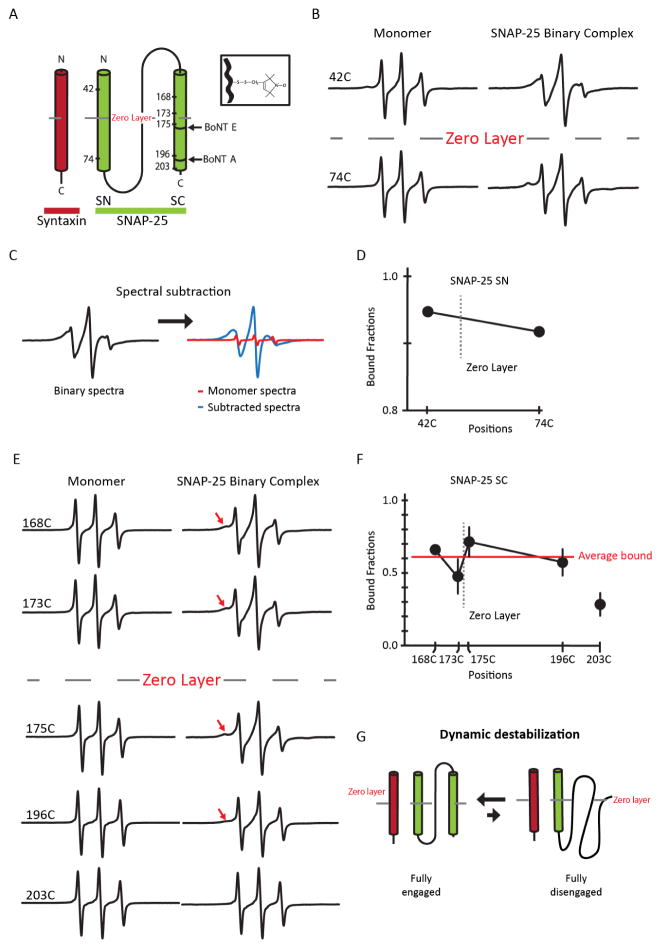
Figure 1. EPR spectra and analysis of spin-labeled SNAP-25 as monomers and part of the 1:1 binary t-SNARE complex.
(A) Schematic representation of the site-directed spin labeling EPR of the t-SNARE complex with syntaxin 1A (red) and SNAP-25 (green). SNAP-25 is denoted with spin labeled positions and BoNT A and E cleavage sites. The conserved zero layer is represented by a dashed line. The inset depicts chemical structure of the spin label (MTSSL) attached to the cysteine side chain. (B) Room temperature EPR spectra for A42C and A74C in the SN domain in monomeric SNAP-25 or in the t-SNARE complex. (C) Representative EPR spectral subtraction analysis. The composite binary EPR spectrum (black) was subtracted by the monomer spectra (red) to obtain the broad, interacting spectral component (blue). (D) Bound fraction of the labeled positions (SN domain) in the t-SNARE complex obtained from the spectral subtraction analysis. The data are shown as means ± SD. (E) Room temperature EPR spectra for the labeled positions in the SC domain in monomeric SNAP-25 or in the t-SNARE complex. The red arrow indicates areas of EPR lineshape broadening. (F) Bound fraction of the labeled positions (SC domain) in the t-SNARE complex obtained from the spectral subtraction analysis. The average bound fraction (red) of spin labeled positions G168C, T173C, N175C, and N196C is 0.61. Position 203 was excluded when calculating the mean due to its position being near the end the SC domain which is known to be frayed and unstructured. The data are shown as means ± SD. (G) Model of dynamic equilibrium of the SNAP-25.

