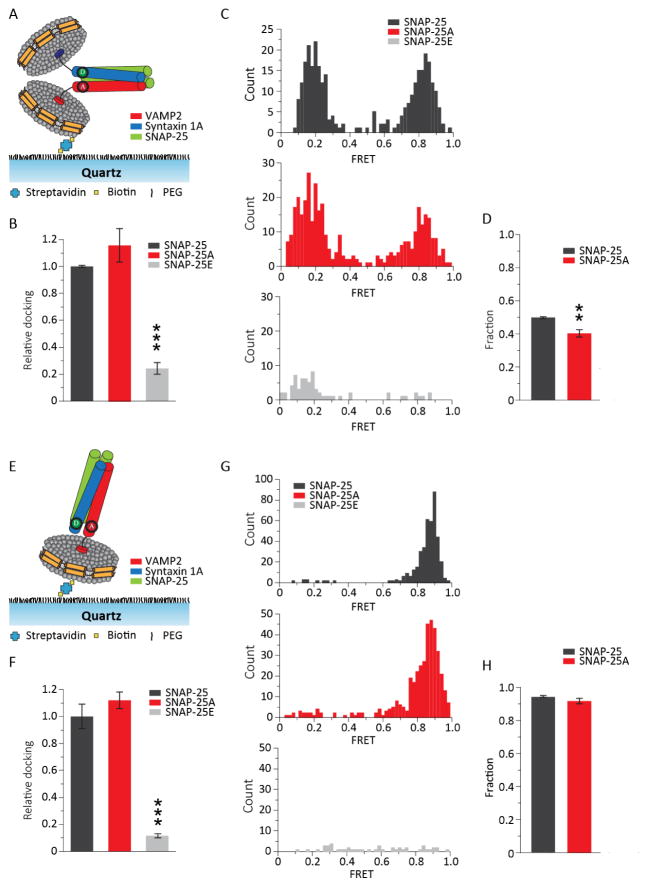
Figure 3. smFRET analysis of the ternary trans- and cis-SNARE complex using nanodiscs.
(A) Schematic of a nanodisc sandwich harboring a single trans-SNARE complex with the FRET pair at the C-terminal region (CC). VAMP2 A72C-Cy3 and syntaxin 1A V241C-Cy5 were used for CC. (B) Relative docked nanodisc sandwiches for SNAP-25A and SNAP-25E normalized to SNAP-25 are shown as means ± SD. Docking was significantly reduced with SNAP-25E. (C) Histogram of the FRET efficiency distribution for SNAP-25 (top), SNAP-25A (middle) and SNAP-25E (bottom). The distribution showed two distinct populations in the high and in the low FRET regions for SNAP-25 and SNAP-25A. The distribution for SNAP-25E is not well organized. Total of 307, 380 and 69 traces were analyzed for SNAP-25, SNAP-25A and SNAP-25E respectively. (D) The fraction of the high FRET population from the trans-SNARE complex. Approximately half of the population is distributed in the high FRET region for SNAP-25 and SNAP-25A. (E) Schematic a single cis-SNARE complex (CC) anchored to a single nanodisc by the syntaxin 1A transmembrane domain. (F) Relative co-localized Cy3-Cy5 spots for SNAP-25A and SNAP-25E normalized to SNAP-25. Co-localized spots are significantly reduced with SNAP- 25E. Data are shown as means ± SD. (G) Histogram of the FRET efficiency distribution for SNAP- 25 (top), SNAP-25A (middle) and SNAP-25E (bottom). The distribution showed one distinct population in the high FRET regions for SNAP-25 and SNAP-25A. The distribution for SNAP- 25E was not well organized. Total of 422, 411 and 47 traces were analyzed for SNAP-25, SNAP- 25A and SNAP-25E respectively. (H) The fraction of the high FRET population from the cis- SNARE complex. In (B), (D), (F) and (H), the data are shown as means ± SD (*p < 0.05, **p < 0.01, and ***p < 0.005 by Student’s t test; n = 3 independent experiments).

