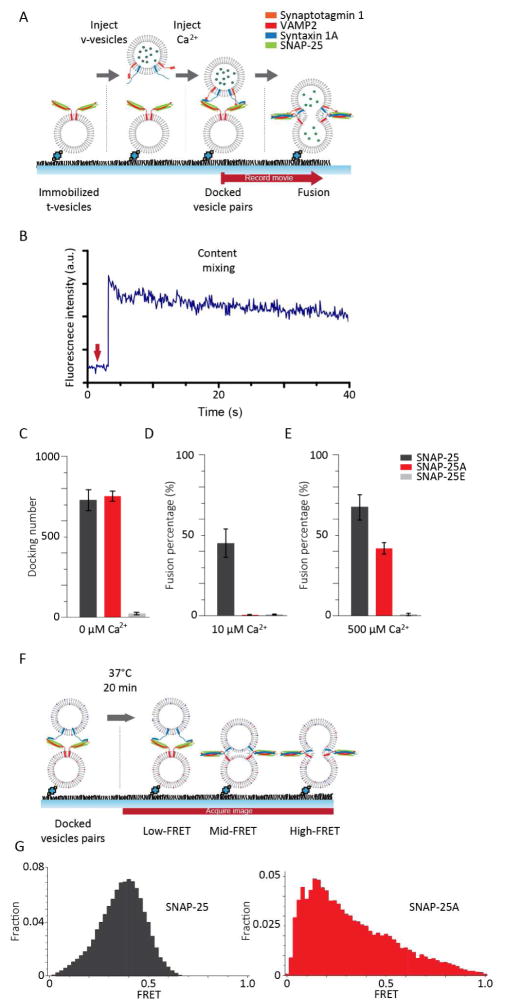
Figure 4. SNAP-25A is unable to trigger SNARE-mediated membrane fusion with 10 μM Ca2+.
(A) Schematic of the in vitro single-vesicle content-mixing assay. After the t-vesicles are immobilized on the imaging surface, unbound t-vesicles were washed out and subsequent docking and washing of unbound v-vesicles were also performed. Once the v-vesicles and t-vesicles are docked, we injected Ca2+ into the flow chamber to evoke content-mixing which are detected by a sudden step-wise increase of fluorescent intensity. The flow chamber maintained constant 100 nM Cpx concentration throughout the experiment. (B) A representative fluorescent intensity time trace is shown in blue. The stepwise increase indicates content-mixing. The red arrow indicates the time Ca2+ was added to the flow chamber. (C) Bar graph of the average number of docked vesicles-vesicle pairs from 3 recordings. Bar graph of the average fusion percentage from 3 recordings are shown for (D) 10 μM Ca2+ and for (E) 500 μM Ca2+. (F) Schematics of the in vitro single-vesicle lipid-mixing assay. The single-vesicle lipid-mixing assay was identical to the content-mixing assay prior to Ca2+ injection with the exception of using DiI and DiD instead of SRB. (G) The FRET distribution between the docked vesicle-vesicle pairs for prepared with SNAP-25 and SNAP-25A are shown left and right, respectively.

