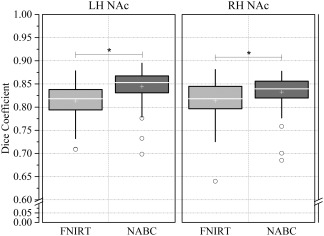
Figure 1.

Comparisons between FNIRT and NABC. Box and whisker plots show the Dice (registration accuracy) between the deformed source and the target label volumes and then the average across brain pairs. Box lines at the lower quartile, median and upper quartile values, and whiskers extend from each end of the box to 1.5 times the interquartile range. Outliers were indicated by “o.” A paired samples t‐test tested the differences between the two methods (*P < 10−4). LH: left hemisphere; RH: right hemisphere.
