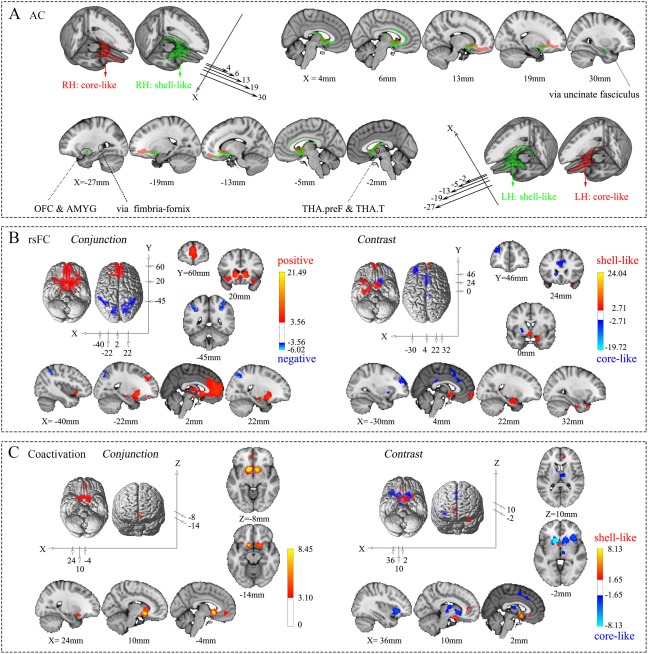
Figure 4.

Connectivity patterns of the shell‐like and core‐like subdivisions. (A) Population maps of the probabilistic tractography results from the two NAc subregions in the bilateral hemispheres were thresholded at 70% and are portrayed on the MNI152 standard brain in 3D and multislice presentations, respectively. (B) Conjunction and contrast analyses of the voxel‐wise rsFC of the two NAc subregions in the left hemisphere. The former shows the common positive and negative connections, using red–yellow and blue–cyan color ranges, respectively, while the latter shows the specific connections with the shell‐like and core‐like subdivisions, using red–yellow and blue–cyan color ranges, respectively. (C) Conjunction and contrast analyses of the voxel‐wise coactivation of the two NAc subregions in the left hemisphere. For specifics about the color ranges, please refer to the explanation in (B).
