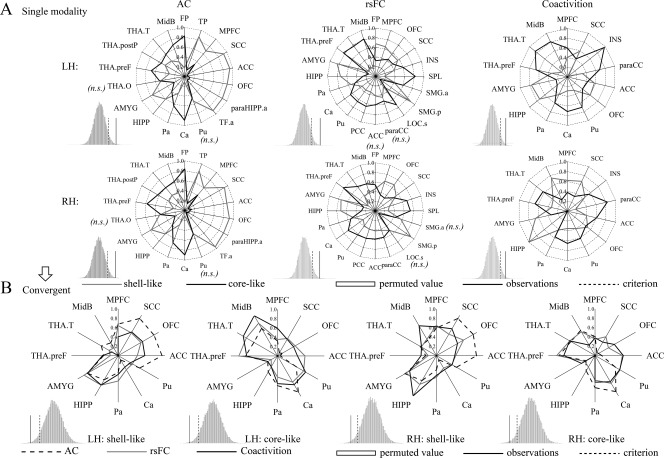
Figure 5.

Connectivity fingerprints of the shell‐like and core‐like subdivisions. (A) Left, middle, and right two panels show the AC, rsFC, and coactivity fingerprints, respectively. For each target area, the connectional differences between the two subregions with this target area were tested using a paired samples t‐test (HCP‐40 dataset). “n.s.” indicates that no significant difference was found. For the fingerprint, the differences between the two NAc subregions was greater than expected by chance after the permutation tests (histograms); that is, the observation was greater than the criterion, indicating clearly distinct profiles for the shell‐like and core‐like subdivisions in the three connection types. (B) The intersection of the fingerprints across three connection types was extracted as the convergent connectional family. The new AC, rsFC, and coactivation fingerprints of the bilateral NAc subregions are shown in blue, red, and cyan lines, respectively. Permutation tests showed that the difference between these fingerprints was smaller than expected by chance, indicating convergent connectivity profiles across three modalities for the shell‐like and core‐like subdivisions.
