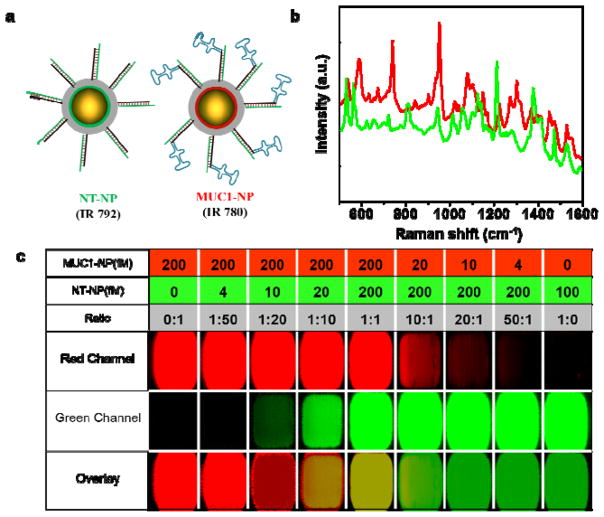
Figure 4.
(a) A schematic representation of the NT-NP and MUC1-NP. IR 792 and IR 780 dyes are used as Raman reporters for NT-NPs and MUC1-NPs, respectively. MUC1-NPs are functionalized with MUC1 aptamers on a ds-DNA corona, while the NT-NPs lack the MUC1 aptamer region. (b) The Raman spectra of NT-NP (green) and MUC1-NP (red) showing distinct spectral signatures. (c) Determination of limit of detection of NT-NPs and MUC1-NPs in tissue phantoms (100% laser power, 1.5 s integration time, 5× objective). Different wells have different concentrations and ratio of MUC1-NPs and NT-NPs as described in the table above. The limit of detection of individual NPs was found to be ~10 fM and ratios up to 1:20 ratio of either particle can be distinguished using the DCLS algorithm inbuilt in the WiRE 3.4 software.

