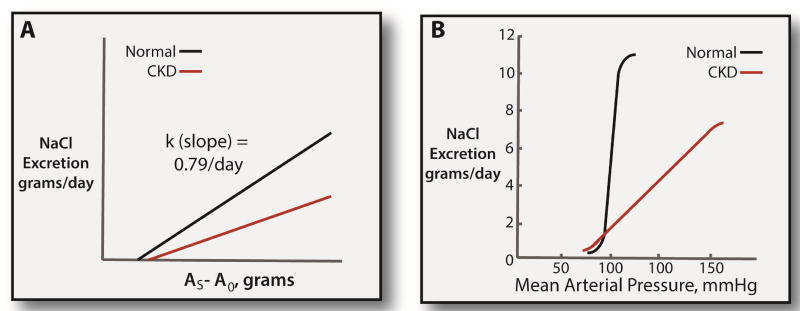
Figure 1. Renal function curves in normal individuals and CKD.
Panel A: relationship between NaCl excretion and body sodium chloride content (AS) above a basal value (A0). This analysis is based on Walser.69 The slope of the normal relationship (k, which is a time constant) is taken from Walser’s review of the literature. The slope appears to be reduced by CKD. Panel B: Classic renal function curve, as drawn by Guyton and colleagues.6 As argued by Guyton, CKD shifts the renal function curve downward and to the right, describing the increased salt-sensitivity in this population.

