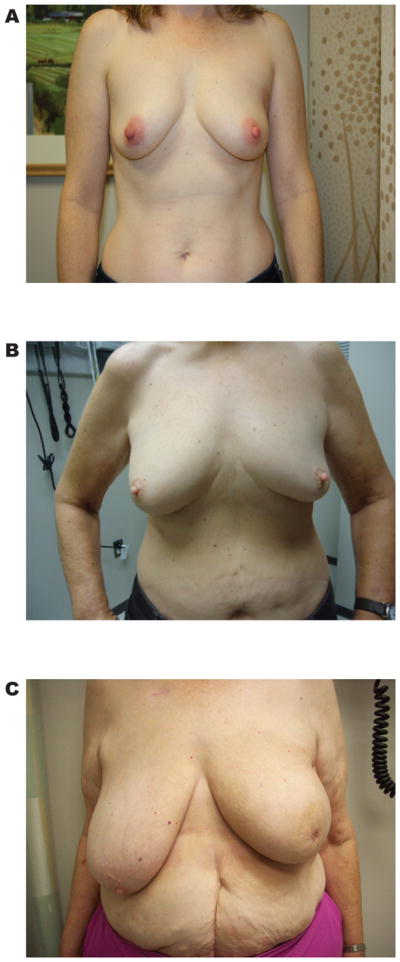
Figure 2.

Photographs of patients at the one-year follow up visit across a spectrum of values for M1. Panel A, a patient with a high value of M1 (M1=0.99). Panel B, a patient with an intermediate value of M1 (M1=0.93). Panel C, a patient with the lowest value of M1 in the cohort (M1=0.71).
