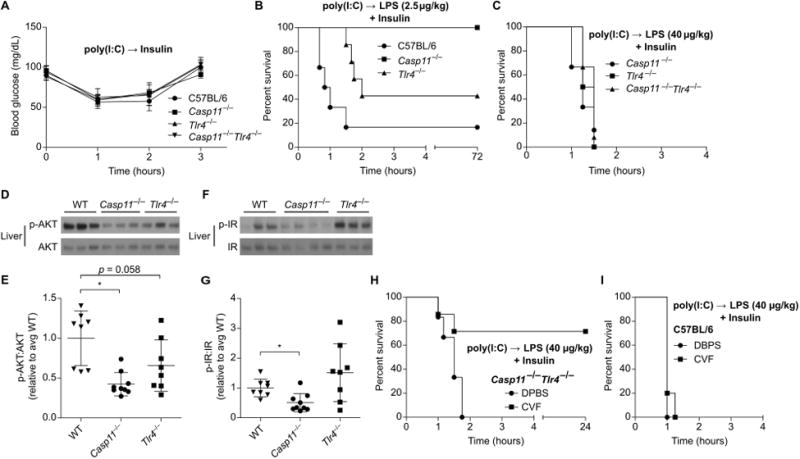
Fig. 5. LPS enhances insulin signaling via caspase-11, TLR4, and complement.

(A) Blood glucose concentrations over time in mice treated with insulin. Pooled data from 2 experiments. (B and C) Survival of mice after challenge with insulin and LPS (B, 2.5 μg/kg; C, 40 μg/kg). Pooled data from 2 experiments. (D - G) Phosphorylation of liver AKT (D, E) and insulin receptor (F, G) determined by Western blot 1 h after challenge as in (B). Densitometry data are pooled from 3 experiments. (H, I) Survival of control or CVF treated mice after challenge with LPS (40 μg/kg) and insulin. Pooled data from 2 experiments. Error bars, mean ± SD. Statistically significant differences were determined by a 2-tailed unpaired t-test; * P ≤ 0.05.
