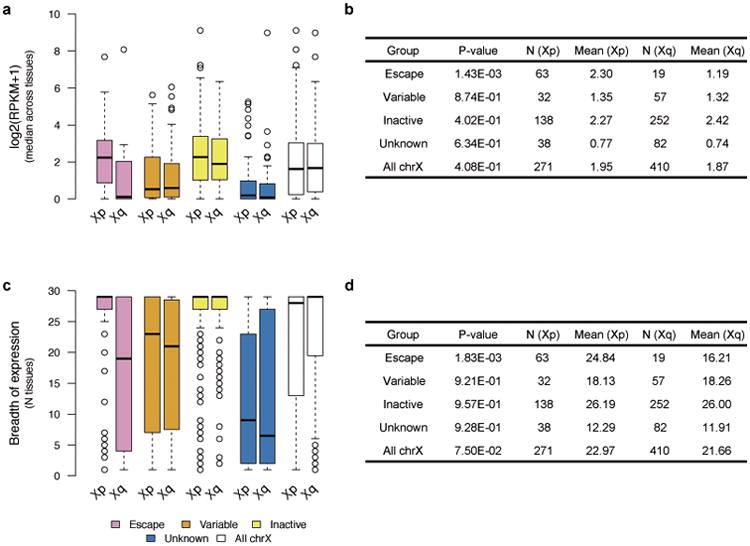
Extended Data Figure 5. Comparison of expression characteristics between Xp and Xq, the evolutionary newer and older regions of chrX, respectively, by XCI status and for the whole chromosome.

a) and b) show level of median expression across GTEx tissues in log2 RPKM units, and c) and d) show the breadth of expression measured as the number of tissues (max = 29) in which genes are expressed (median expression across samples > 0.1 RPKM and expressed in more than 10 individuals at >1 counts per million). P-values are calculated using the Wilcoxon Rank Sum test. All genes expressed in at least one tissue are included in the comparisons.
