
Figure 5.
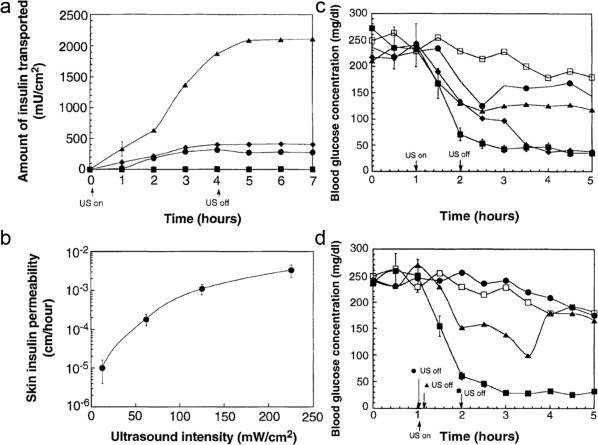
Ultrasound‐mediated transdermal insulin delivery. (a) Time variation of the amount of insulin transported across human skin (in vitro) in the presence of ultrasound (20 kHz, 100‐ms pulses applied every second) at 12.5 (▪), 62.5 (♦), 125 (•), and 225 mW/cm2 (▲). (b) Variation of the transdermal insulin permeability (in vitro) with ultrasound intensity (20 kHz, 100‐ms pulses applied every second). (c) Time variation of blood glucose concentrations of 16‐week‐old hairless rats on 1 hr insulin‐ultrasound treatment at 12.5 (•), 62.5 (▲), 125 (♦), and 225 mW/cm2 (▪). (d) Time variation of blood glucose concentration of hairless rats exposed to ultrasound (20 kHz, 225 mW/cm2, 100‐ms pulses applied every second) for different times. Ultrasound was turned on at 1 hr and was turned off after 1 min (•), 10 min (▲), and 1 hr (▪). Control (□). Reproduced with permission from Ref. 115