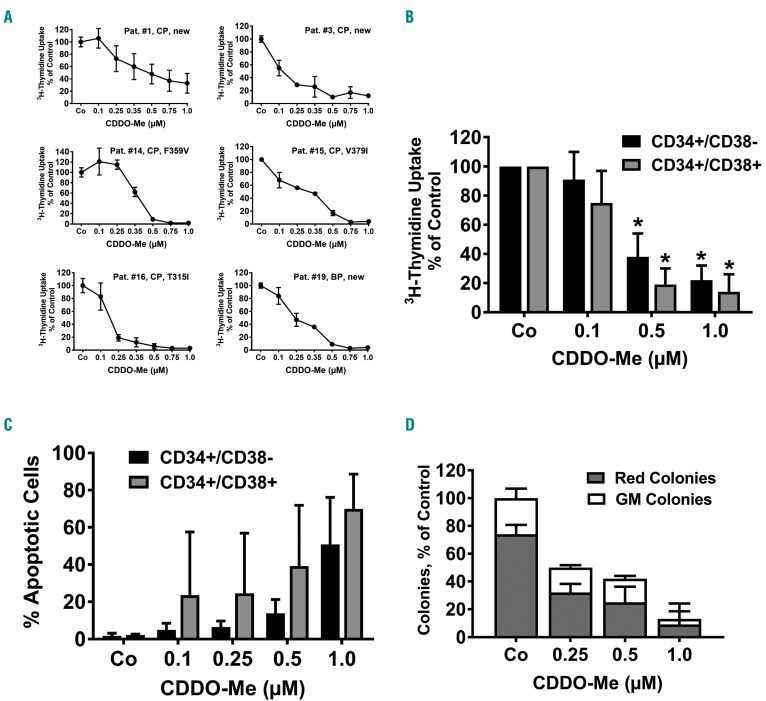
Figure 2.
CDDO-Me counteracts the proliferation of primary chronic myeloid leukemia (CML) cells. (A) Primary CML cells were isolated from the peripheral blood (PB) of 6 patients [chronic phase (CP) n=5; primary blast phase (BP) n=1]. In 3 patients, cells were obtained at diagnosis (“new”). In all 3 TKI-resistant patients, BCR-ABL1 mutations were detected as indicated. Isolated cells were incubated in control medium (Co) or various concentrations of CDDO-Me as indicated at 37°C for 48 hours (h). Then, proliferation was measured by assessing 3H-thymidine incorporation. Results are expressed in % of control and represent the mean±Standard Deviation (S.D.) of triplicates. Patients’ numbers refer to Table 1. (B) Highly purified CD34+/CD38− stem cells (black bars) and CD34+/CD38+ precursor cells (gray bars) were sorted from peripheral blood (PB) leukocytes of 3 patients (#9, #11 and #17) and were kept in control medium (Co) or various concentrations of CDDO-Me as indicated at 37°C for 48 h. Then, proliferation was measured by assessing 3H-thymidine incorporation. Results are expressed as % of control and represent the mean±S.D. of 3 patients. *P<0.05 compared to control (Co). (C) Primary PB mononuclear cells (MNC) were isolated from 3 patients (#9, #11, #17) and kept in control medium (Co) or various concentrations of CDDO-Me at 37°C for 48 h. Thereafter, cells were subjected to flow cytometry to determine the % of apoptotic (Annexin V+) CD34+/CD38− (stem) cells (black bars) and CD34+/CD38+ (progenitor) cells (gray bars). Results represent the mean±S.D. of 3 patients. (D) PB MNC from 3 patients (#9, #10, #11) were cultured in methylcellulose with cytokines in the absence (Co) or presence of various concentrations of CDDO-Me as indicated for 14 days. Then, the numbers of granulocyte/macrophage (GM) colonies (white bars) and red cell-containing (burst-forming plus erythroid) colonies (gray bars) were counted under an inverted microscope. Results are expressed in % of control (100% = red colonies + GM colonies in the absence of CDDO-Me) and represent the mean±S.D. of 3 patients.

