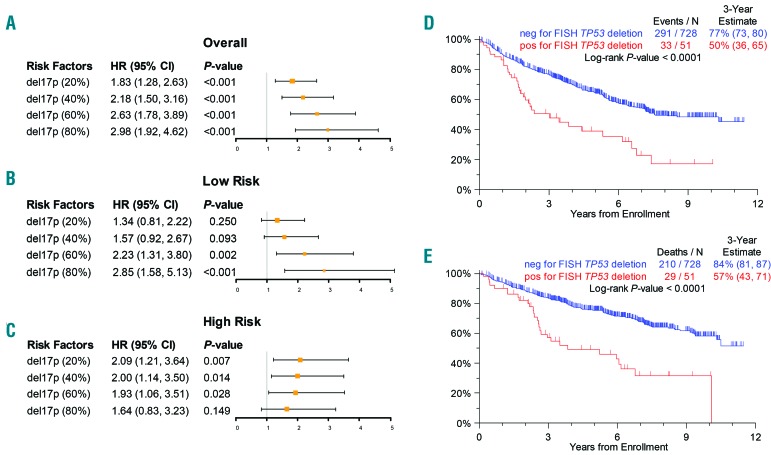
Figure 1.
Survival data (A–C). Forest plots of overall survival hazard ratios for different cut points for (A) overall population; (B) low-risk patients; (C) high-risk patients. (D,E) Kaplan-Meier plots for survival of the overall population in TT3-5 using a 60% cut-point. (D) Progression-free survival. (E) Overall survival.

