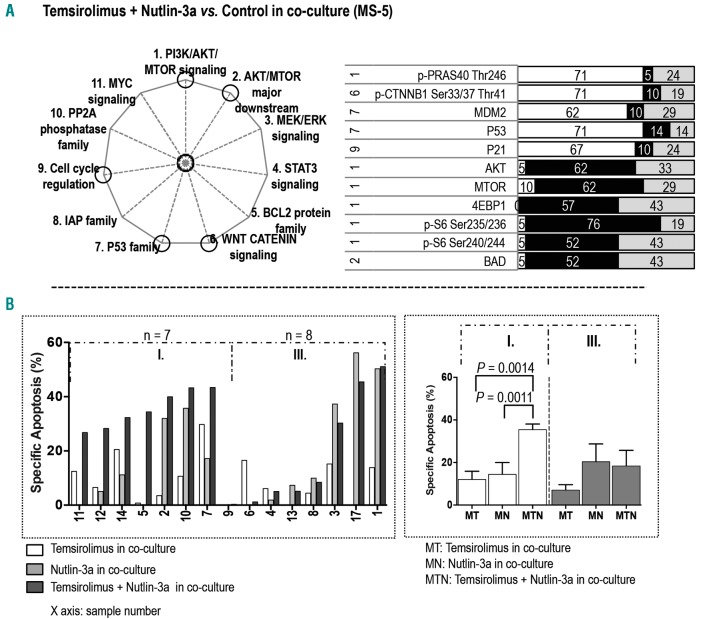
Figure 5.
Combined blockade of PI3K/AKT/MTOR and MDM2 signaling with temsirolimus and Nutlin-3a demonstrated higher efficacy in AML under co-culture. (A) The pathways affected by combination treatment with temsirolimus and Nutlin-3a are circled in the pie chart. The bar graph displays proteins whose expression was significantly altered in samples treated with the combination of temsirolimus and Nutlin-3a (n = 21) versus the matched samples without treatment in co-culture. The numbers on the left are the numbers of the pathways (as indicated on the pie chart on the left and in the Online Supplementary Figure S1). The calculation of the black, white, and gray area and the color key on the bar graph are described in the legend for Figure 1. (B) The bar graph on the left displays the specific apoptosis for each co-cultured sample treated with temsirolimus, Nutlin-3a, and the combination of temsirolimus and Nutlin-3a. The sample groupings and the statistical calculation of apoptosis are described in the Online Supplementary Materials and Methods. The bar graph on the right displays the specific apoptosis in each group. Values are presented as mean ± standard error of the mean.

