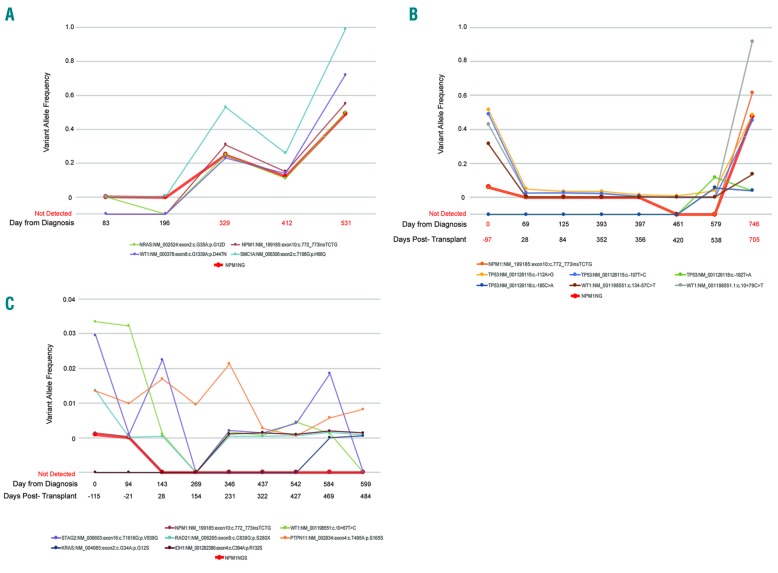
Figure 3.
Detection of MRD and clonal heterogeneity in patient specimens using smMIP capture. Results are shown for patient 1 (A), patient 2 (B), and patient 3 (C). The variant allele frequency of the individual somatic mutations identified in each case are plotted as a function of time (in days) the first sampling in the time series and, where available, days status post-transplant. Days marked in red indicate time points at which neoplastic cells were detected by conventional clinical assays. Correlation of results with alternative testing for NPM1 mutation are indicated for each case (NPM1NGS, double thick line).

