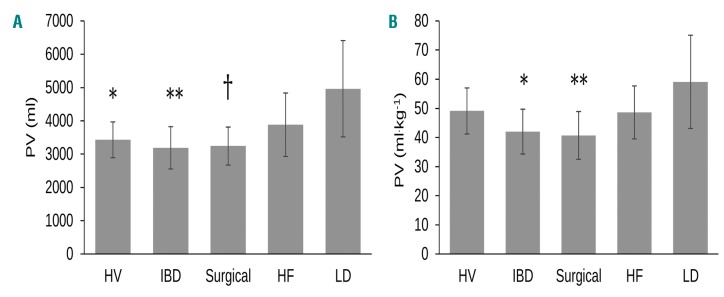
Figure 2.
Plasma volume in healthy volunteers and patient sub-groups. Plasma volume (ml & ml.kg−1) (A & B). (A) PV (ml) between LD and HV, *P=0.006, PV (ml) between LD and IBD, **P=0.002 and PV (ml) between LD and surgical patients, †P=0.003; (B) PV (ml kg−1) between LD and IBD, *P=0.008, PV between LD and surgical patients, **P=0.004. Data expressed as mean (± standard deviation error bars). HV: healthy volunteers; IBD: inflammatory bowel disease; HF: heart failure; LD: liver disease; PV: plasma volume.

