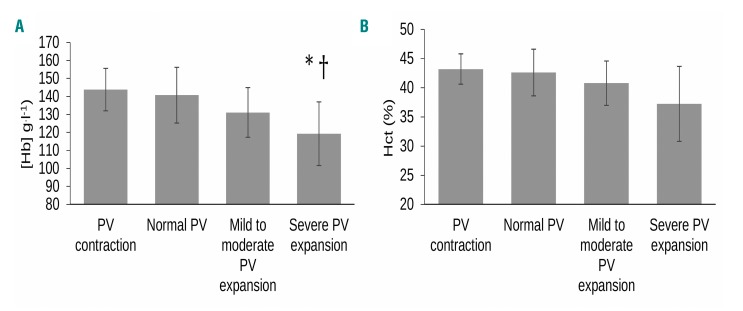
Figure 3.
Hemoglobin concentration and hematocrit in all patients categorized by plasma volume status. Plasma volume contraction (n=3) was classified as > minus 8% from expected norms. Normal PV (n=24) was classified as derived PV within ± 8% of the expected normal volume on an individual level. Mild to moderate volume expansion (n=36) was considered >8% to <25% deviation from expected norms, and severe PV expansion (n= 46) as >25% of the expected normal volume. *P=0.005 for [Hb] in severe PV expansion vs. mild to moderate, †P<0.0001 for [Hb] in severe PV expansion vs. normal PV. Data expressed as mean (± standard deviation error bars). PV: plasma volume; [Hb]: hemoglobin concentration (g.l−1); Hct (%): hematocrit percentage.

