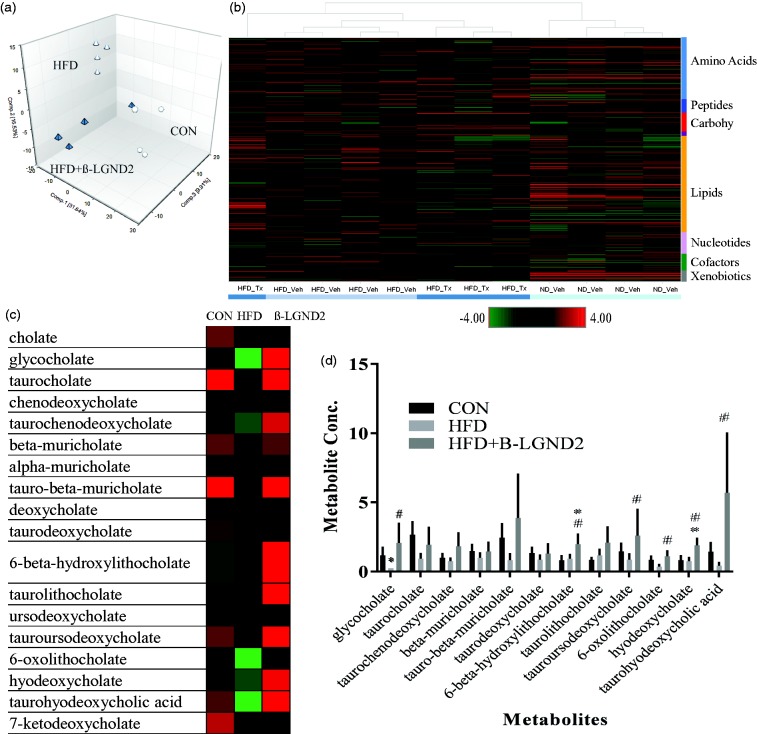
Figure 5.
β-LGND2 regulates bile acid metabolites. Male C57BL/six mice (n = 5/group) were maintained on a normal diet (CON) or high fat diet (HFD) and treated with vehicle or 30 mg/kg/day s.c. β-LGND2 for 10 weeks. Mice were sacrificed and liver sections were snap frozen and metabolites were measured (n = 4/group). (a) Principal component analysis (PCA) showing the metabolites of individual samples. Circles represent CON-fed animals, white triangles represent HFD-fed vehicle-treated animals, while green triangles represent HFD-fed β-LGND2-treated animals. (b) Heat map (of metabolites q < 0.05) showing hierarchical clustering of individual samples. (c) Various bile acid metabolites expressed in the liver of mice maintained under different conditions. (d) Levels of bile acid metabolites are provided as bar graphs. Values are expressed as average ± SE. * indicates significance at q < 0.05 from CON-fed mice and # indicates significance at q < 0.05 from HFD vehicle-treated mice

