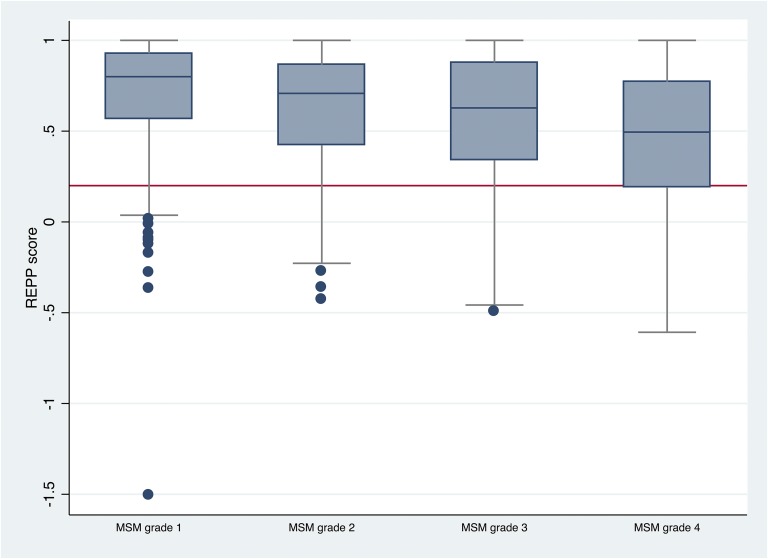
Fig. 3.
Box-and-whisker plot describing the relative effect per patient (REPP) score with each musculoskeletal morbidity (MSM) grade. The whiskers indicate the interquartile range and the length of the whiskers indicates the 1.5 times interquartile range. The red line indicates a REPP score of 0.2; patients with a REPP score of >0.2 are considered as responders who were favorable to the surgical procedure.

