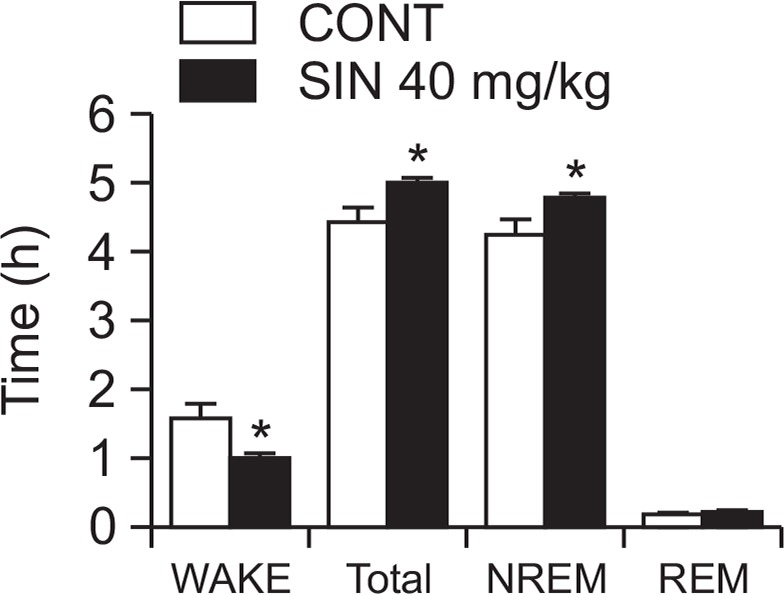
Fig. 5.

Effect of SIN on rat sleep architecture. The data show the mean ± SEM of time spent, which separated the wakefulness and sleep (NREM and REM) states. The significance of the compounds’ effects was assessed using ANOVA. Where there was significant variability, the individual values were compared using Student’s t-test. *p<0.05, compared with that of the naïve control.
