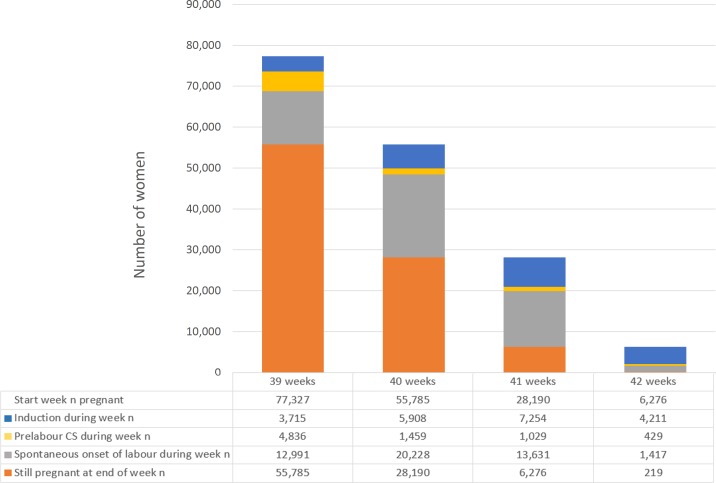
Fig 2. Composition of cohort by week of gestation.
For each week of gestation (column), the primary analysis compares women who were induced at week n (blue column segment) with women who were expectantly managed, defined as those who delivered at weeks >n (orange column segment). The secondary analysis compares women who were induced at week n (blue column segment) with those who were expectantly managed according to the alternative definition, i.e., delivered at weeks ≥n (orange, grey, and yellow column segments). Abbreviation: CS, caesarean section.

