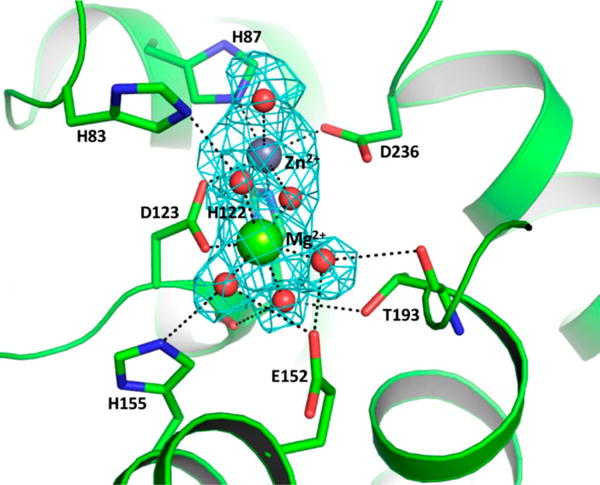
Figure 9.

Active site of PDE monomer A, showing metal ion coordination, water molecules, and hydrogen bonds to active site residues. The figure shows an omit map (Fo − Fc = 3σ) with electron density for the Zn2+ and Mg2+ ions in the active site of monomer A. The water molecules and Zn2+ and Mg2+ ions are modeled as red, purple, and green spheres, respectively.
