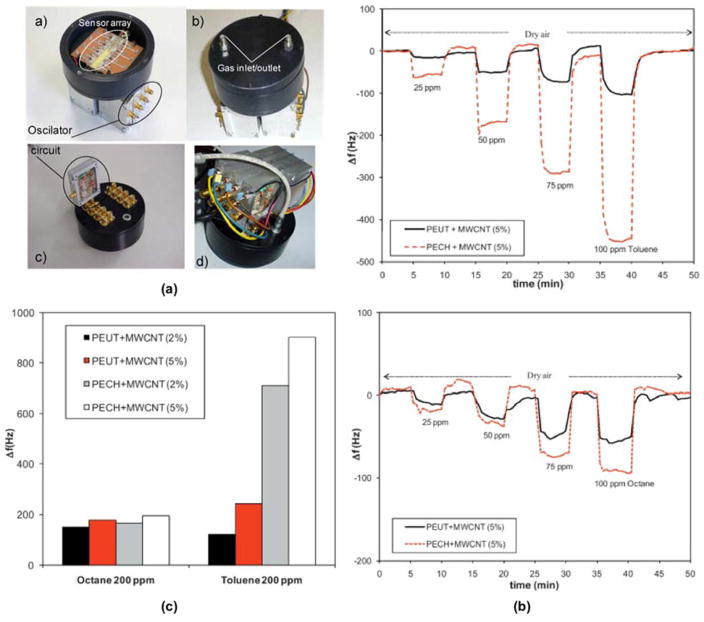
Fig. 3.
(a) The sensor array and testbed including oscillator circuits; a) and b) are the front view and c) and) are the back view. (b) Dynamic response to different concentrations of (top) octane and (bottom) toluene, at room temperature. (c) Sensor responses at 200 ppm to octane and toluene at room temperature. Adapted from Ref. [52] with permission from Elsevier.

