Figure 2.

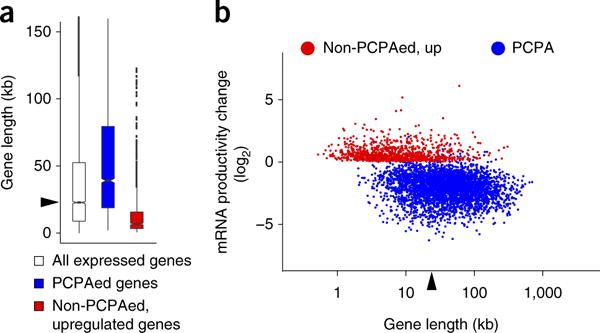
The effect of U1 inhibition and gene size on PCPA and full-length mRNA productivity. (a) Boxplots showing the gene-size distribution of PCPAed genes (n = 3,590; median 39.0 kb), non-PCPAed, upregulated genes (n = 988; median 6.8 kb) in the 8 h 4-shU-labeled RNA-seq from cells treated with U1 AMO compared to all expressed genes in control (n = 9,744; RPKM ≥ 1; median (22.8 kb) indicated by arrowhead). Boxplot midlines represent the median, box limits span the first and third quartiles, whiskers represent 1.5× the interquartile range (IQR) and points indicate outliers. (b) Scatter plot showing mRNA expression level changes in 8 h 4-shU labeled RNA-seq. mRNA productivity change was determined from the ratio of all exon reads for non-PCPAed and upregulated genes (shown in red). For the PCPAed genes (shown in blue), exon 1 reads were excluded from the calculations in both control and U1 AMO, as accumulation of PCPAed transcripts in some genes (~6%) made them appear as upregulated despite loss of full-length mRNA. The median gene length of all expressed genes (RPKM ≥ 1), 22.8 kb, is indicated by an arrowhead. The coordinates (x,y) of genes noted in the text are: EGFR (17.5, −2.3), EXT1 (18.3, −3.4), RAB7A (16.4, −0.8), E2F3 (16.5, −3.5), MYC (12.4, 1.6), CYR61 (11.6, 1.7), GAPDH (12.0, 0.05). The x,y coordinates are log2 values of gene length and fold change, respectively; for example, MYC (12.4, 1.6) corresponds to 5.4 kb and 3.0-fold increase. A list of PCPAed genes is summarized in Supplementary Table 2.
