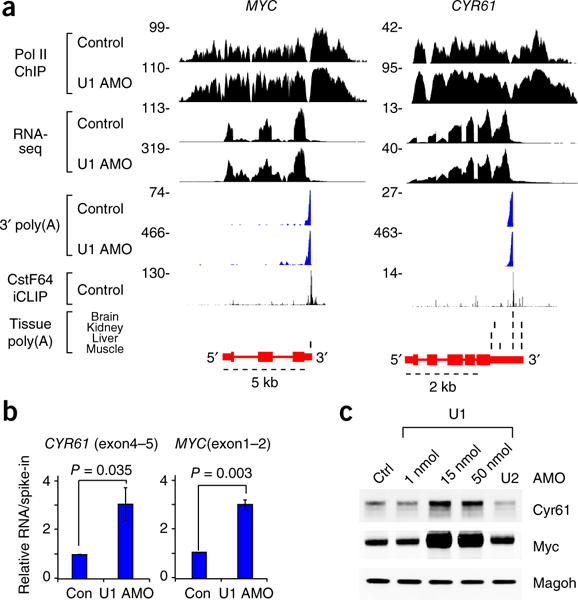
Figure 3.

mRNA productivity upregulation in small non-PCPAed genes. (a) Representative examples of genes (MYC; CYR61) showing both PCPA resistance and increased mRNA expression. Data are presented as described for Figure 1. (b) Non-PCPAed small genes are upregulated. Purified, 4-shU-labeled RNAs from HeLa cells transfected with control or U1 AMO were used for RT-qPCR analysis. ERCC RNA spike-in controls added to each sample before rRNA depletion were used for normalization. Data are represented as mean ± s.d. (n = 3, independent cell cultures). P value was calculated with two-tailed Student’s t-test. (c) Protein expression from non-PCPAed small genes is upregulated with U1 AMO treatment. HeLa cells were transfected with control AMO, various doses of U1 AMO (1, 15 and 50 nmol) or 50 nmol of U2 AMO for 8 h and total cell extracts were used for western blot analysis. Magoh was used as a loading control. Uncropped blot images are shown in Supplementary Data Set 1.
