
Figure 4.
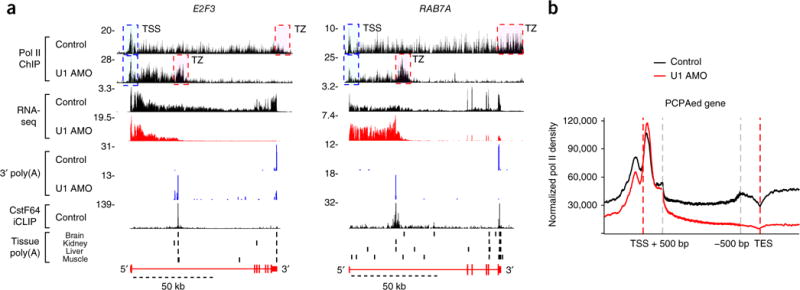
PCPA is cotranscriptional and prematurely terminates pol II elongation in gene bodies. (a) Genome browser views of pol II ChIP-seq and RNA-seq from HeLa cells 8 h after control or U1 AMO transfection. Data are presented as described for Figure 1. E2F3 and RAB7A genes show pol II signal declining after the PCPA point with U1 AMO. TSS (blue) and TZ (red) dashed boxes represent the transcription start site and termination zone, respectively. (b) Metagene plot of pol II ChIP-seq reads for PCPAed genes, identified in Figure 2 (n = 3,590), with control (black) or U1 AMO (red), relative to the TSS (−1,000 bp to +500 bp) and TES regions (transcription end site; 500 bp upstream of the annotated mRNA 3′ ends and 1,000 bp downstream). Regions between TSS + 500 bp and TES − 500 bp of each gene body were scaled to 2 kb.