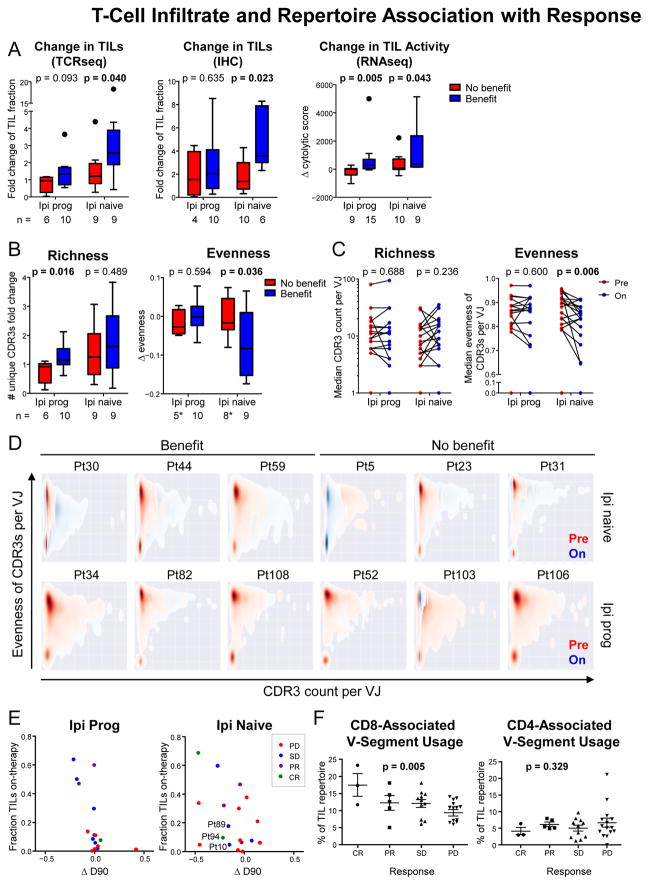
Figure 5. T-Cell Infiltrate and Repertoire Association with Response to Nivo.
Due to the reduced number of cases with paired TCR-seq data, patients with CR/PR and SD were grouped as having “benefit”, and patients with PD were considered to have “no benefit”.
(A) Change in TIL abundance and activity as measured by multiple methods (DNA-based TCR-seq, IHC, and RNA-based cytolytic score). Data are presented as median and IQR.
(B) Change in richness and evenness of intratumoral T-cell repertoires. *Two outliers were removed per Grubbs’ test, alpha = 0.1 (see Methods). Data are presented as median and IQR.
(C) Median richness and evenness of CDR3s per VJ combinations pre-therapy and on-therapy (see also Figure S6E).
(D) Kernel density plots of CDR3 evenness versus number of unique CDR3s for every observed VJ pair in selected patients.
(E) Comparison of on-therapy TIL levels with changes in T-cell repertoire evenness (D90, defined as the minimum fraction of total unique CDR3 sequences that constitutes 90% of all sequencing reads).
(F) Fraction of on-therapy TCR repertoire utilizing V-segments associated with CD8 or CD4 T cells. Data are presented as mean ± SEM.

