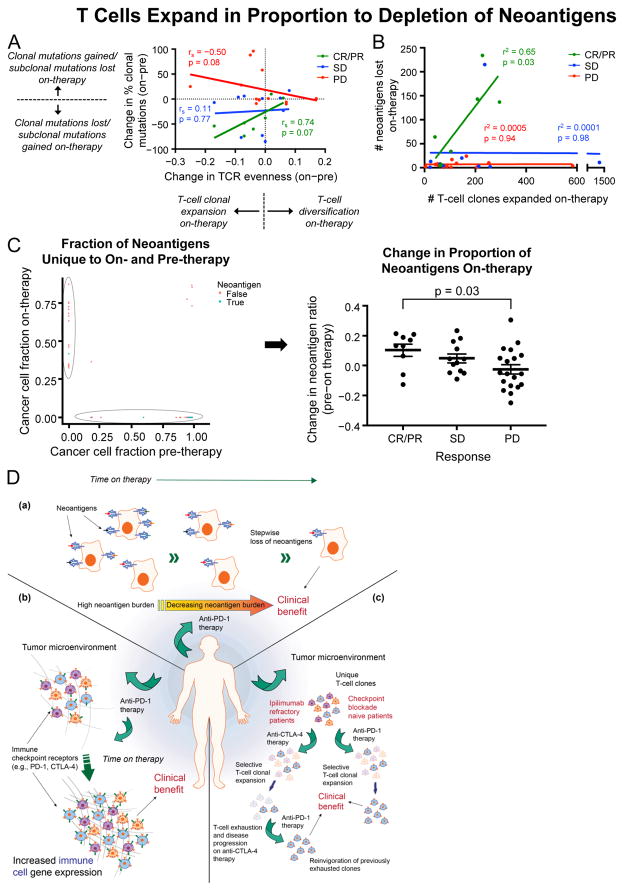
Figure 6. T Cells Expand in Proportion to Depletion of Neoantigens.
(A) Changes in T-cell population distribution (i.e., evenness) and changes in tumor mutation clonality by response.
(B) Relationship between the number of predicted neoantigens lost and the number of T-cell clones expanded on-therapy.
(C) Neoantigen ratios (mutations predicted to generate neoantigens per mutations not predicted to generate neoantigens) from mutations solely identified in pre-therapy samples compared with those identified solely in on-therapy samples. Data are presented as mean ± SEM.
(D) Graphical model depicting changes during anti-PD-1 therapy. (a) Changes in mutations and neoantigens during therapy. (b) Changes in TCR repertoire depend on exposure to prior immunotherapy. (c) Changes in immune landscape and checkpoints during therapy.

